
Abstract
Alzheimer’s Disease (AD) is one amongst the overwhelming types of dementia that distresses the brain nerve cells leading to a perpetual loss in memory and creating a lot of difficulties for the family members in caretaking. The prediction of the disease at an earlier stage is a common problem. The most prevalent imaging modalities used for diagnosing AD are Magnetic Resonance Imaging (MRI), Positron Emission Tomography (PET) and Single Photon Emission Computed Tomography (SPECT). They can provide valuable information regarding the changes in internal and external brain regions and activities for diagnosing AD. But the relevant studies made on retina reveals that in addition to brain changes there are some variations on the retina layers of the AD patients. Therefore, the retina can be used as a biomarker for diagnosing AD. There are different techniques available for an eye examination. Most noticeable of them are Fundus Imaging and Optical Coherence Tomography (OCT). In this paper, we have focused on OCT retinal images of AD patients for the early diagnosis of AD.
Author Contributions
Academic Editor: Roberto Paganelli, University of G. D'Annunzio Chieti and Pescara unich Department of Medicine and Science of Aging Chieti, Italy
Checked for plagiarism: Yes
Review by: Single-blind
Copyright © 2019 Sandeep C S, et al.
 This is an open-access article distributed under the terms of the Creative Commons Attribution License, which permits unrestricted use, distribution, and reproduction in any medium, provided the original author and source are credited.
Competing interests
The authors have declared that no competing interests exist.
Citation:
Introduction
Dementia is a brain disorder that leads to total degradation in memory as well as physical activities. The different types of dementia that are known today are Alzheimer’s disease, Vascular dementia, Parkinson’s disease, Dementia with Lewy bodies, Huntington’s disease, Creutzfeldt-Jakob disease, Frontotemporal dementia, Normal pressure hydrocephalus, Down syndrome dementia, Korsakoff syndrome and Posterior cortical atrophy. The Figure 1 shows the different types of dementia type brain diseases. From these, Alzheimer’s disease (AD) is a type of senile dementia, is an irreversible progressive dysfunction of the brain as well as retina that causes cognitive impairment 1, 2, 3. There are several causes of the disease, but the two most prominent hallmarks of AD are amyloid beta (Aβ) proteins and tau proteins. Aβ proteins are those which accumulate outside the nerve cells of the brain and tau proteins are those which deposit inside the nerve cells or fibers, blocks the incoming and outgoing signals from the brain to other parts of the body and vice versa 4, 5, 6. The early changes of AD occur mainly in three regions, entorhinal cortex, hippocampal regions and internal layers of the retina. These changes are due to the effect of the two proteins that are discussed above. Another after-effect of these proteins is the variation cerebrospinal fluid (CSF) levels, leads to cortical shrinkage of the brain 7. The early diagnosis of AD is the most important task to delay disease progression and for better treatment. The other important thing is to differentiate AD from other types of dementia. Therefore the physician has to make some neurological examination to evaluate the memory impairment is due to AD and not from other malfunctions of the brain such as stroke, other dementia diseases, and tumors. The various tests for diagnosing AD are clinical tests, neuropsychological tests, and neuroimaging tests. The clinical tests include blood tests, CSF test and testing other parameters of the human body that leads to AD. The neuropsychological tests include the Mini-Mental State Examination (MMSE) and the memory clock drawing test to screen the memory dysfunction of AD patient 9. The neuroimaging tests include Magnetic Resonance Imaging (MRI), Positron Emission Tomography (PET), Single Photon Emission Computed Tomography Scanning (SPECT) and Optical Coherence Tomography (OCT). These imaging techniques modalities will help to find out a solution that whether AD is due to normal aging or other reason for cognitive degradation 8, 9, 10, 11.
Figure 1.Dementia type of brain diseases
MRI, PET, and SPECT help to see the variations inside the brain for diagnosing AD. But relevant studies and investigations made on dementia of Alzheimer’s type reveal that there are variations on the internal layers of the retina, especially in the Retinal Nerve Fiber Layer (RNFL) in the earlier stage of AD. The main reason for variations in RNFL is due to the accumulation of Aβ protein, which is one of the most important hallmarks of AD. Due to the abnormal behavior of retina, there are disabilities in eyesight, defects in the retinal cortex, loss of anterior visual pathways, and dysfunction of nerves in optics and retinal ganglion cells 12. Therefore we can correlate losses in visual properties with cognitive losses in the early stage of AD. From the above, it is clear that instead of examining brain region such as the hippocampus, there is a possibility of examining the areas associated with visual function 13. In this case, the use of OCT for examining the internal layers of the retina can be used for diagnosing AD in the earlier stage. For this purpose, a population-based study is necessary and required for clinical trials. In this study, we have focused on the retinal changes through OCT examination for the early diagnosis of AD. Therefore retina can be used as a biomarker to measure the disease progression.
Literature Review
MMSE is a screening test that is used to find out the suspected AD subjects by interviewing the patients. Before going to any major analysis, screening is very important. After the screening process, OCT analysis has been done. In the OCT analysis, there are different steps such as segmentation, feature extraction and classification are required. Segmentation is a very important significant method in the automated computer prediction of medical pictures. Most significant and common strategies for segmentation of medical pictures are fuzzy logic; support vector machines (SVMs) and artificial neural networks (ANNs) 14. Additionally to those techniques, another technique that has been used for the segmentation of medical pictures is wavelet Networks (WNs). The advantages of wavelet Networks are noise drop-off, saving in the background, retrieval of the characteristic knowledge and Neural Network (NN) ability of collective approximation. These benefits build the WNs used wide in several medical applications 15. An extra feature of WNs is that it will overwhelm the various limitations in computational intelligent approaches like ANNs. In this research, we have proposed a technique based on WNs for the segmentation of MRI pictures. WNs may be classified into 2 completely different classes, adaptive wavelet networks (AWNs) and discrete wavelet Networks (DWNs). AWNs use Continuous Wavelet Transforms (CWTs), whereas DWNs may be a Discrete Wavelet Transform (DWT). The main limitations of AWNs are complicated calculations and sensitivity to initial values than DWNs. The following features of DWNs over AWNs created us choose the forerunner 16. The factors like the number of wavelets, scale, and shift parameters value are often determined easily. The neuronic weights, the only inner parameter of the network, are determined by algorithms like the least squares. Additionally, to this DWNs do not need training. In the case of AWNs, initial values like weights of neurons, shifts, scales of wavelets are selected in a random manner. Therefore in the proposed DWNs, there is no need to specify random initial values for parameters. Thus, it may be summarized that DWNSs do not need a training procedure. In this research after the segmentation process, necessary features are extracted. Therefore, the aim of this research is to handle the most findings OCT in AD subjects, to discuss the role of OCT in AD subjects and the way OCT scans concerned in the early prediction of AD.
Screening Process Using MMSE
For the early diagnosis of AD using image analysis, there should a screening process that is to be made initially. From the laboratory tests such as blood tests or other common tests, it cannot screen the patients whether patients is having AD or not. In this scenario, different neuropsychological tests to examine the mental health and cognitive dysfunction of AD subjects has been used. It includes Rey Auditory Verbal Learning Test, Trial Making Test parts A and B, category fluency, Digit Span forward and backward, Digit Symbol Substitution Test, the Clock Drawing task and Mini Mental State examination (MMSE). In this Research MMSE for screening the subjects has been chosen. It can be used to systematically and thoroughly assess mental status. CE tool is used to find out the cognitive function of the patient with an eleven questionnaire method. MMSE really measures the five areas of mental status. The five areas are orientation, registration, attention and calculation, recall and language. In the orientation section different questions like month, year, place etc. were asked and the total score of this section is 10 points. In the registration section, examiner asks the name of different objects and gives a maximum score of 3 points. In the attention and calculation section, the examiner asks the subject to count backwards and will give 0 to 5 points. In the recall section, the examiner asks to name the previously told objects in the registration section and give 0 to 3 points. The fifth or final section is the language section in which the subject is asked some question related to vocabulary and gives 0 to 9 points. Finally, the total score or points are calculated for maximum of 30 points. If the score is above 23, the patient is assumed to have no Alzheimer’s. If the score lies between 18 to 23, the subject are having mild AD, if the score lie between 10 to 17, the subject is having moderate AD and if the score is less than 10, the subject is having severe AD. The scoring table is shown in Table 1. From Table 1, if the score is below 24, there is a certain case of dementia of Alzheimer’s type. If there is a decline of the score, the severity of AD changes from mild to severe condition.
Table 1. Score and conditions of dementia stages| scores | condition |
| 24 – 30 | Normal |
| 18 – 23 | Mild dementia |
| 10 – 17 | Moderate dementia |
| <10 | Severe Dementia |
A total of 50 subjects with the screening tool that we developed with the coordination of medical experts have been interviewed. For the selection of the subjects, some criteria such as the education are minimum 10th standard and no previous head injury records have been made. Thus from the interviewed 50 subjects, the normal male subjects are 10 and female are 16. Likewise in mild condition, male, 2 subjects and there is no female. In the moderate condition, male-11 and female-8 and in the severe condition, 2 males and one female. The comparison of male and female subjects is shown in Figure 2.
Figure 2.Comparison of male and female subjects
Also summarize the age group and the dementia condition as in Table 2. From the table the dementia starts from the age of 55 and continuously progressing has been seen. AD can be classified into early onset and late onset. Early onset starts before the age of 65. Hence in this work, 2 subjects have late onset dementia and they are female. The moderate condition ranges from 66 to 75, in which 11 females and 8 males are affected. The severe condition ranges from 76 to 85, in which 2 females and 1 male are affected.
Table 2. Condition and age group| condition | age group |
| normal | 45-55 |
| mild | 55-65 |
| moderate | 65-75 |
| severe | 75-85 |
The retina of the eye can be called as a biomarker for predicting dementia of Alzheimer’s type. The connection between the retina and the brain is shown in Figure 3. From the figure, we can see how the retina is connected to the visual cortex of the brain region through the optic nerve. In the case of AD, there are visual abnormalities due to the accumulation of Aβ protein 17. In addition to AD, Diabetic Retinopathy (DR), Multiple Sclerosis (MS) and Parkinson’s Disease (PD) are also involved in retinal abnormalities. But the important point is that to differentiate AD from other retinal related brain disorders. In the early stage of AD, there is a condition of RNFL thinning. Therefore an efficient and noninvasive imaging technique should be used for finding the thickness measurement. The prominent techniques used for the evaluation of RNFL thickness are Confocal Scanning Laser Ophthalmoscopy (CSLO), Scanning Laser Polarimetry (SLP), Pulsatile Ocular Blood Flow, Doppler Ultrasonography and Optical Coherence Tomography (OCT) 18. In this research we have chosen OCT imaging technique as it is used in the local hospitals of India. Also the cost of taking OCT is very less compared to other techniques and a reliable method for diagnosing the disease.
Figure 3.The connection between the retina and visual cortex
Alzheimer’s Finding Through OCT
Optical Coherence Tomography (OCT) is a noninvasive technique that provides a cross-sectional view of internal layers of retinal regions. The images obtained through OCT are high-quality resolution pictures 19. It uses the principle of interferometry to obtain the cross-sectional view of retinal layers that can be utilized to evaluate the RNFL thickness for the early diagnosis of AD.OCT can be taken in the time domain and spectral domain (SD). In the time domain it can produce approximately 400 scans per second and in the spectral domain, it can produce approximately 200000-400000 scans per second. Also, the resolution of scans obtained through the spectral domain is much better than the time domain. Therefore SD-OCT can be efficiently used for scanning the retinal layers, especially the RNFL. During the OCT scanning process, it is easier to attain 6 linear scans pinpointed on the Optical Nerve Head (ONH). The already installed OCT software automatically derives the ONH parameters. The OCT scan is capable of giving horizontal and vertical cup-to-disc ratios. For evaluating the RNFL region, it uses the RNFL thickness circle scan mode consisting of 3 scans that are circular and double the radius of 3.4 mm centered on the ONH. Thus it is possible to find out automatically the quadrant, average and overall RNFL thicknesses for diagnosing AD. For better results to evaluate the RNFL thickness, the parameter we have taken in account is the focused picture of the fundus with high quality, good signal-to-noise ratio, and the presence of a centered, circular ring around the ONH. For comparing AD and control subjects, the average value of the RNFL thicknesses in each quadrant should be used. Figure 4 shows the OCT image of normal and AD.
Figure 4.OCT image of Normal (left) and AD (right) (Source: SGM&RF)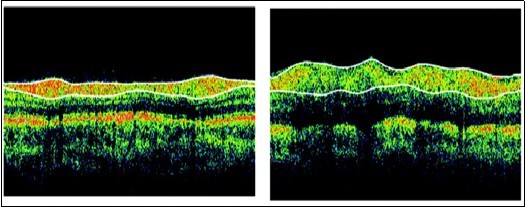
Oct Image Analysis for Diagnosing AD
Optical Coherence Tomography (OCT) is a noninvasive as well as an efficient technique that provides a cross-sectional view of internal layers of retinal regions. After the screening of the patients has been done, the diagnosing of the patient is required. In this paper, OCT imaging methods is used. Therefore the screened patients have been sent for OCT scanning to obtain the OCT images. For the diagnosis of AD using OCT images, the different steps involved are image acquisition, image segmentation, feature extraction, and classification 20. The image acquisition is done by using the OCT machine. Here the image segmentation is done by using Wavelet networks. After that, the different features are extracted and finally the classification of images has been done 21. The input images are of noisy one and it is filtered by using a median filter. After filtering, channel separation is done for red, green and blue images. Then the normalisation technique is applied to each image. During the segmentation process using wavelet networks, a wavelet scan is formed from a function, called "mother wavelet," which is confined in a finite interval. A single scaling multidimensional wavelet frame is employed for mother wavelet creation which provides better regularities and also the ease of frame generation in comparison with wavelet basis. After creating mother wavelet, "daughter wavelets” are formed by shifting, scaling of the mother wavelet. Wavelets are mostly useful for reducing the size of OCT image data from a larger one 22. The output signal of a wavelet network with one output, d inputs and q wavelons in the hidden layer is given by the equation (1).
 ……...(1)
where wi, i =1,2,..., n, are weight coefficients, ψpi and qi is dilated and translated versions of a mother wavelet function, ψ, pi, qi are scale, shift parameters, respectively 22. In this paper, we have used the combination of Marr Wavelet and Morlet Wavelet to build the Wavelet Network for the segmentation process. The Marr Wavelet function is given as in equation 2 and Morlet Wavelet function is given in equation 3 23.
ψ1(x) = [(d – abs (x2) * ê (-abs (x2/2) ………. (2)
ψ2(x) = Ce-x2/2*cos(5x) ……. (3)
For creating the wavelet Network, we have combined the second and third equations with dimension d=2 and the constant C=1. Finally, the equation becomes as shown in 4.
ψ(x) = [((d -abs (x2) * ê(-abs (x2/2))) * (Ce-x2/2*cos(5x))] …….. (4)
The above equation helps to build the structure of the Wavelet Network. Therefore this wavelet network can be called as Marr-Morlet Wavelet Networks (MMWNs). Next is to train the wavelet using Neural Networks and finally we get the segmented image 24. The succeeding stage after segmentation is the feature extraction of the OCT images. Some of the features extracted are Area, Orientation, Major Axis Length, Minor Axis Length, Eccentricity, Centroid, 'and Euler Number. The segmentation of an OCT image is shown in Figure 5.
Figure 5.(a) input image (b) Marr-Morlet output (c) segmented image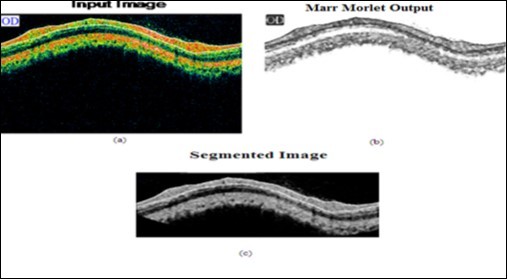
We have compared the segmentation results with Fuzzy C Means (FCM), K Means Clustering (KMC), and Region seed growing (RSG) which is shown in Table 3
Table 3. Comparison of our method with other types| Method | Accuracy | Precision | Sensitivity | Specificity |
| Proposed | 99.65 | 93.77 | 93.32 | 98.82 |
| FCM | 98.53 | 91.15 | 92.34 | 98.73 |
| KMC | 97.83 | 81.28 | 82.94 | 97.83 |
| RSG | 96.63 | 79.15 | 80.22 | 96.52 |
`After extracting the features, the most important part is the classification of OCT images. For this purpose, we have used Neural Network method of classification. Accordingly, Back Propagation (BP) and Radial Basis Function (RBF) type NN method has been used. We have compared both functions, in this case, NN using RBF produce good results. Finally, we classified the selected patients’ images with the OCT analysis technique that we developed using Marr-Morlet Wavelet Networks (MMWNs). The result obtained through CE tool is the same as that of OCT analysis.
From the above sections, it is clear that Alzheimer’s disease can be diagnosed through the retina, especially the OCT imaging technique. In order to make an expert system for predicting AD, a large database is required. The first step in diagnosing AD is to screen the patients using clinical and neuropsychological tests to know whether the patient is demented or not. After that, the AD patients have to be diagnosed with the OCT technique as instructed by the ophthalmologist. The images obtained through OCT should be taken under the same environmental conditions. The images obtained from the OCT device should be saved in an electronic format for creating the OCT database. For an expert system using OCT images for the early prediction of AD, segmentation, feature extraction, feature selection and classification of OCT images have to be done. The findings made using this analysis can indicate that the OCT method can be used for diagnosing AD in the early stages. The required databases of this paper preparation are obtained from Sree Gokulam Medical College and Research Foundation, Trivandrum. We have selected 50 patients for the study. First, we have interviewed the selected patients using the MMSE test. The patients are interviewed for a maximum score of 30 based on orientation, registration, attention and calculation, recall, and language. The score below 24 reports that the patient is having AD. From the total 50 patients, 25 are having the score less than 24, 30 are having the score greater than 23. Thus from the interviewed 50 subjects, the normal male subjects are 10 and female are 16. Likewise in mild condition, male, 2 subjects and there is no female. In the moderate condition, male-11 and female-8 and in the severe condition, 2 males and one female. After the screening section is over, the selected 24 AD patients have been sent to OCT scanning for taking the images of the retina, especially the RNFL layer for the diagnosis of AD. The scanned images are saved as a bitmap file for further processing. The size of each image was 535,974 byte; the database images employed in this paper are made free from noise or other artifacts by filtering or pre-processing stage. The OCT image is then segmented using WNs with the help of a combination of Marr-Morlet wavelet function. After segmentation, feature extraction has done and finally, classified the OCT images using NNs. We have compared our method with other techniques like Fuzzy C Means (FCM), K Means Clustering (KMC), and Region seed growing (RSG) and got better results. We have analysed the OCT images obtained from the selected 50 patients and classified that the 26 patients are normal and 24 are demented. Thus we got the same result as that of the screening process.
Conclusion
There are a lot of tests, drug therapies, biomarkers and neuroimaging techniques are available for the diagnosing AD. A definite diagnosis of AD can be done through autopsy. In this scenario, the OCT method can be widely used without disturbing the patient, as it is less expensive, noninvasive and easier to use. The early diagnosis of AD can lessen various ill effects and complications. Using OCT, it is possible to set a clinical follow up to carrying out the diagnosis. As the prevalence of AD is becoming a disturbance for the whole world, OCT imaging can provide better results than other modalities in terms of effort, cost and time. In this research, screening process is done to select the patients. After the screening, patients have been sent to OCT image analysis. The segmentation of OCT has been done with MMWNs and compared with other techniques and got better results. The classification of OCT is done with Neural Networks. The different advantages of OCT analysis includes such as a medical aid to doctors for diagnosing AD, support family members, has good sensitivity, specificity, high efficiency and less cost for taking OCT images for diagnosing AD than other major techniques.
Acknowledgements
The authors are thankful to Sree Gokulam Medical College and Research Foundation, Trivandrum, India for providing the necessary database of OCT images for the preparation of the paper
References
- 1.Ohno-Matsu K. (2011) Parallel findings in age-related macular degeneration and Alzheimer’s disease. Prog Retin Eye Res. 30, 217-238.
- 2.Locascio J J, Growdon J H, Corkin S. (1995) Cognitive test performance in detecting, staging, and tracking Alzheimer’s disease.Arch. Neurol.52: 1087-1099.
- 3.Bradshaw J R, JLG Thomson, Campbell M J. (1983) . Computed tomography in the investigation of dementia.BMJ286: 277-280.
- 4.Katzman R. (1990) Should a major imaging procedure (CT or MRI) be required in the workup of dementia?: an affirmative view.J. Fam.Pract.31: 401-410.
- 5.Sandeep C S. (2015) Sukesh Kumar A. Disease (AD) through Different Tests, Techniques, and Databases. AMSE JOURNALS –2015-Series 76(1): 1-22.
- 6.Ivnik R J, Malec J F, Smith G E, Tangalos E G, Petersen R C. (1996) . Neuropsychological tests’ norms above age 55: COWAT, BNT, MAE Token, WRAT-R Reading, AMNART, STROOP, TMT, and JLO.Clin.Neuropsychol.10: 262-278.
- 7.Becker P M, Feussner J R, Mulrow C D, Williams B C, Vokaty K A. (1985) The role of lumbar puncture in the evaluation of dementia: the Durham Veterans Administration/Duke University study.J. , Am.Geriatr. Soc.33: 392-396.
- 8.Oliveira L T, Louzada P R, Mello F G, Ferreira S T. (2011) Amyloid-b decreases nitric oxide production in cultured retinal neurons:a possible mechanism for synaptic dysfunction in Alzheimer’s disease?. , Neurochem Res 36, 163-169.
- 9.C S Sandeep, A Sukesh Kumar, M J Susanth. (2017) Cognitive examination for the early diagnosis of Alzheimer's disease,". International Conference on Trends in Electronics and Informatics (ICEI) , Tirunelveli 108-112.
- 10.Kesler A, Vakhapova V, Korczyn A D, Naftalive E, Neudorfer M. (2011) Retinal thickness in patients with mild cognitive impairment and Alzheimer’s disease. , Clin Neurol Neurosurg 113, 523-526.
- 11.Guo L, Duggan J, Corderio M F. (2010) Alzheimer’s disease and retinal neurodegeneration. , Curr Alzheimer Res 7, 3-14.
- 12.C S Sandeep, A S Kumar, Mahadevan K, Manoj P. (2017) Classification of OCT images for the early diagnosis of Alzheimer's disease,". International Conference on Intelligent Computing and Control (I2C2), Coimbatore 1-5.
- 13.McKee A, Au R, Cabral H. (2006) Visual association pathology in preclinical Alzheimer disease. , J Neuropathol Exp Neurol 65, 621-30.
- 14.Cheng K-S, Lin J-S, Mao C-W. (1999) Techniques and comparative analysis of neural network systems and fuzzy systems in medical image segmentation,” Fuzzy Theor. , Syst. Tech. Appl 3, 973-1008.
- 15.Jiang J, Trundle P, Ren J. (2010) Dec “Medical image analysis with artificial neural networks,”. , Comput. Med. Imag. Graph 34(8), 617-631.
- 16.R M Balabin, R Z Safieva, E I Lomakina. (2008) Aug “Wavelet neural network (WNN) approach for calibration model building based on gasoline near infrared (NIR). , spectra,” J. Chemometr. Intell. Lab. Syst 93(1), 58-62.
- 17.Kesler A, Vakhapova V, Korczyn A D. (2011) Retinal thickness in patients with mild cognitive impairment and Alzheimer’s disease. , Clin Neurol Neurosurg 113(7), 523-526.
- 18.Frost S, Martins R N, Kanagasingam Y. (2010) Ocular biomarker for early detection of Alzheimer’s disease. , J Alzheimers Dis 22(1), 1-16.
- 19.Ohno-Matsu K. (2011) Parallel findings in age-related macular degeneration and Alzheimer’s disease. Prog Retin Eye Res. 30(4), 217-238.
- 21.Sandeep C S, A Sukesh Kumar, Mahadevan K, Manoj P. (2018) . Analysis of Retinal OCT Images for the Early Diagnosis of Alzheimer's Disease”, Springer-Advances in Intelligent Systems and Computing book series (AISC), ISSN 2194-5357, Vol.749: 509-520.
- 22.Szu H H, B A Telfer, S L Kadambe. (1992) Sep “Neural network adaptive wavelets for signal representation and classification,”. , Opt. Eng 31(9), 1907-1916.