Abstract
This study was conducted to evaluate the effect of the substitution of fishmeal by Lima bean flouron the growth performance, survival rate and feed cost of Clariasgariepinusbetween March and May 2018 within the AIO ICG of the Batié District. It also aimed to contribute to the development of alternative sources of animal protein on a global scale. For this purpose, 300 fry of Clariasgariepinuswith an average weight of 3 ± 1.41g were divided into five batches and fed three times a day with rations corresponding to 5% of their ichthyobiomass. The rations R0, R25 R50, R75 and R100 respectively corresponded to the substitution rates of 0, 25, 50, 75 and 100% of fish meal by that of Lima bean. The physic-chemical characteristics of the water (pH, temperature, dissolved oxygen, nitrites and nitrates) were measured daily. The following results were obtained: The highest weight gains were obtained with the rations R25 (20.56 ± 0.40 g), R50 (20.64 ± 0.32 g), R75 (20.98 ± 0.46 g) and the lowest with the rations of R100 (16.21 ± 0.28 g). The highest average daily gain were 0.36 ± 0.02 g; 0.37 ± 0.01 g ; 0.38 ± 0.01 g respectively for the R0, R50 and R75 rations and the lowest with R100 (0.29 ± 0.01 g). The highest value of the specific growth rate (2.47 ± 0.07%) was obtained with the ration R0 and the lowest (1.61%) with the ration R100. The consumption index reached its highest and lowest values with the rations R100 (4.74 ± 0.42) and R50 (3.57 ± 0.43) respectively, compared to the value of the ration R0 (3.31 ± 0.37) for this parameter. Concerning the condition factor K, the highest value was recorded with the R50 diet (1.11 ± 0.49) while the lowest value was obtained with the R75 diet (0.95 ± 0.45). The cost of producing one kilogram of food was higher with the R25 ration (504.59 FCFA) and lower with the R100 ration (443.20 FCFA). Our results revealed that incorporating 75% Lima bean flour into the feed increases the growth performance of Clariasgariepinus fry and reduces the cost of food production.
Author Contributions
Academic Editor: Miklas Scholz, The University of Salford, Newton Building, Greater Manchester, United Kingdom.
Checked for plagiarism: Yes
Review by: Single-blind
Copyright © 2018 Emile Miégoué, et al.
 This is an open-access article distributed under the terms of the Creative Commons Attribution License, which permits unrestricted use, distribution, and reproduction in any medium, provided the original author and source are credited.
Competing interests
The authors have declared that no competing interests exist.
Citation:
Introduction
Global fish production and demand are steadily increasing and have increased fivefold in less than 10 years (FAO, 2017)11. Production increased from 39 million tons in 2010 to 174.1 million tons in 2016 (FAO, 2017)11. In addition, its global per capita consumption per year has increased from an average of 9.9kg in the 1960s to over 20kg in 2016 (FAO, 2016)10. In sub-Saharan Africa, fish products contribute an average of 50% of GDP in protein intake of animal origin but are still insufficient (FAO, 2012)9. In Cameroon, the high protein demand linked to the impetus of the demographic growth of the population is generating interest in fish farming, which represents an alternative that can promote the self-sufficiency of rural populations and food security (Marquet, 1985)20. However, fish farming faces many constraints, the main ones being the lack of fry and quality feed, the unavailability of by-products and the high costs of imported food (Hishamunda and Ridler, 2003, Moehl et al., 2006)14,23. Because of the high costs of imported feeds and the unavailability of certain ingredients, the protein component mainly made of fishmeal, remains the most expensive (Alphonsus et al., 2009)5 and it is urgent to find alternative sources available and less expensive. Thus, several studies have been conducted on the substitution of fishmeal by other protein sources, whether of plant or animal origin (Pouomogne, 1994; Olaniyi and Salau, 2013)25,26,28. Hence, this has led to the initiation or the attempt to replace total or partial fish meal with that of Lima bean (Phaseolus lunatus). The species Phaseolus lunatus is one of the least used legumes in Cameroon. This bean has an amino acid profile similar to that of common beans (Ologhobo, 1980, Aletor and Aladetimi, 1989)27,4 but because of the ignorance of its nutritional potential, its culture is neglected. Thus, in order to get breeders to take an interest in this alternative source of protein, this research work has been initiated with the global objective of contributing to the development of alternative sources of protein in the diet of fish. More specifically, it was undertaken to evaluate the effect of Lima bean flour on the survival rate, growth performance and finally on the economic cost of producing Clariasgariepinus.
Materials and Methods
Study Zone
The study took place within the Joint Initiative Group of Integrated Western Aquaculture (ICG AIO), located between 5 ° 17'0 '' - 5 ° 18'53 '' of latitude North and 10 ° 17'0 '' - 10 ° 19'31 '' east longitude and at an altitude of 1700 m in the West Region of Cameroon, Haut-Plateau Division, specifically in the Batié Sub-division. The climate is the Sudano-Guinean type and includes a rainy season (mid-March to mid-November) and a dry season (mid-November to mid-March). The temperature and average rainfall are respectively 23 °C and 1621 mm / year.
Biological Material
Three hundred (300) Clariasgariepinusfry with a mean weight of 3 ± 1.41 g and a mean total length of 7 ± 1.45 cm were used. These fry were divided into five (5) batches according to the different diets tested. The loading of these fry, resulting from an artificial reproduction made within the GIC, was 20 fry per basin. Lima bean (Phaseolus lunatus) and agricultural byproducts were purchased from the Bafoussam city market.
Production of Lima Bean Flour
Fourteen (14) kilograms of beans were boiled 100°c for 2 hours and then dried under the sun to constant weight. It was then crushed and mixed with other agricultural by-products according to the food rations formulated.
Experimentation and Data Collection
Fifteen (15) circular basins of 1m3 each, filled with drilling water were used. The volume of water in each basin was 900 liters and the water was renewed to two-thirds (2/3) every day. To this, three hundred (300) Clariasgariepinus fry with comparable size and weight were randomly divided into five lots with three replicates per batch. Each batch was randomly assigned to one of the R0, R25, R50, R75 and R100 experimental diets formulated. The compositions and the bromatological characteristics are given in Table 1. The feed was distributed three times a day (7am, 12h and 18h) at 5% of ichthyobiomass (Tomedi et al., 2008, Ani et al., 2013)32,6 for 56 days during the experiment, and the quantity was readjusted after each control fishery.
Table 1. Food Composition, Bromatological Characteristics and Cost of Different Rations| feeds/Ingrédients in % | R 0 | R 25 | R 50 | R 75 | R 100 |
| Fish meal | 18.6 | 13.9 | 9.3 | 4.7 | 0 |
| Bean flour | 0 | 4.7 | 9.3 | 13.9 | 18.6 |
| Cotonseed cakes | 18.6 | 20.2 | 18 | 18 | 24.9 |
| Soybean meal | 18.5 | 20.2 | 22 | 23 | 24.9 |
| Peanut cake | 18.6 | 20.2 | 17 | 23 | 24.9 |
| Remoulding wheat | 7.8 | 5.4 | 3.2 | 3 | 0.00 |
| Rice flour | 7.8 | 5.4 | 3.2 | 4 | 0.00 |
| CMAV | 5 | 5 | 5 | 4 | 5 |
| Palm oil | 3.8 | 3.8 | 5 | 3 | 4 |
| Cassava | 1.5 | 1.5 | 1 | 2 | 1 |
| Total | 100 | 100 | 100 | 100 | 100 |
| Bromatological characteristics | |||||
|---|---|---|---|---|---|
| Crude protein (% DM) | 39.80 | 40.14 | 40.07 | 39.90 | 39.93 |
| Metabolizable energy kcal / g | 2714.86 | 2701.85 | 2752.10 | 2619.04 | 2797.20 |
| Calcium g/kg | 1.70 | 1.43 | 1.24 | 0.94 | 0.74 |
| Phosphorus g / kg | 1.15 | 1.00 | 0.86 | 0.70 | 0.58 |
| Ca/P | 1.49 | 1.43 | 1.42 | 1.35 | 1.27 |
| Price of one kg of feed | 522.19 | 504.59 | 487.09 | 469.48 | 443.20 |
Every two weeks, a control fishery was conducted and 25% of the fish in each treatment were individually weighed using an electronic scale of 0.1 gram precision and measured with a 0.1mm precision icthyometer. This made it possible to evaluate the growth characteristics of the fish and readjust the quantity of food to be distributed during the two following weeks.
In parallel with the data collection, the physical and chemical parameters of the water were obtained in situ between 06:00 and 07:00 in each basin: it consisted of taking the temperature, the pH, the ammonia, the nitrites, nitrates and dissolved oxygen from the water respectively using a HANNA mini-maxi thermometer, a Waterproof pH meter, a Tera nitrite chemical kit, and an EUTECH instrument or meter instrument. At the end of the test, all the fish were counted, weighed and measured.
Survival Rate and Growth Parameters
- The survival rate is the ratio (in percentage) between the number of fish at the end of the observation and the initial number of fish.
Loss of survival (%) = (Final number of fish / Initial number of fish) x100
- Weight gain: It evaluates the growth (weight) of fish at a given time.
Weight gain (g) = Final average weight - Initial average weight
- Average daily gain gives informations on the daily growth rate of fry during the experimental period.
Average daily gain (g / d) = Weight gain / time (number of days).
- Specific growth rate: it helps to evaluate the weight gained by the fish every day from it live weight.
Specific growth rate (%) = (final average weight) * 100 / time; ln = natural logarithm
- condition factor K: it gives the overweight of fish during the experiment.
Condition factor K (%) = (W / LT3) x100 with W = weight in g, L = total length
Consumption index: it is a coefficient which is often used by zootechnicians to characterize the efficiency of feed.
Consumption index = quantity of food served / weight gain
Financial Evaluation
The financial evaluation of the ration was made on the basis of the prices of the different ingredients on the market and on the basis of the cost of production of the kilogram of Lima beans.
- Cost of Feed Consumption = Cost of Kg of Feed x Feed Consumption
- Production Feed Cost = Feed Consumption Cost x Consumption Index
Statistical Analyzes
The growth and biochemical parameters were expressed on mean standard deviation and in percentages. One-way analysis of variance (ANOVA) was used to test the effects of treatment and the Ducan test (at 5% threshold) to separate the means when there was a significant difference. SPSS 20.0 software was used for analysis.
Results and Discussion
Results
Effect of the Substitution of Fishmeal by Lima Bean Meal in the Feed on the Survival Rate of Clarias Gariepinus
The effect of fish meal replacement by Lima bean flour on the survival rate of Clariasgariepinus is shown in Figure 1. It shows that the highest survival rate (98.4 ± 2.3%) was obtained with the R50 ration followed by R75 and R100 (97.6 ± 2.5%). The lowest value (96.5 ± 2.5%) was recorded with the R25 diet, although no significant difference was observed between the diets (R0, R25, R50, R75 and R100).
Figure 1.Effect of fishmeal substitution by Lima bean meal on the survival rate of Clarias gariepinus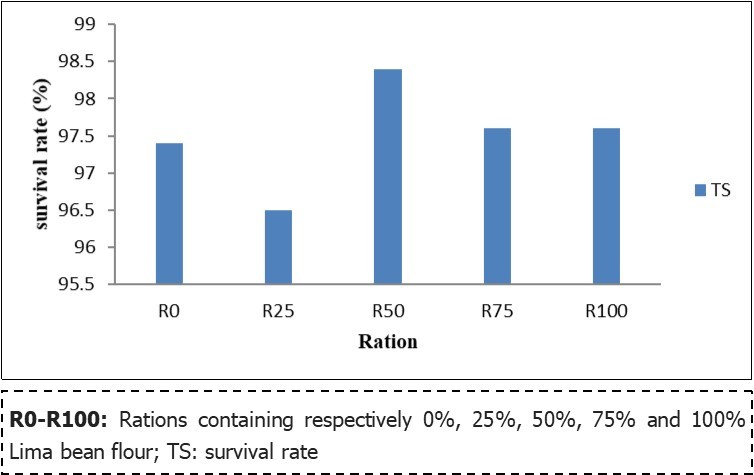
Effect of Fishmeal Substitution by Lima Bean Flour on the Growth Characteristics of Clarias Gariepinus
The effect of the substitution of fishmeal by Lima bean flour on growth characteristics is summarized in Table 2 and illustrated in Figure 2, Figure 3, Figure 4, Figure 5, Figure 6. It is generally apparent that all characteristics were significantly affected. From Table 2, it appears that the R100 diet gave the significantly (p <0.05) lowest weight gains (GP). On the other hand, no significant (p˃0, 05) difference (p˃0, 05) was observed between the other treatments. Regarding average daily earnings (ADG), the lowest significant (p <0.05) value was obtained with the R100 ration. The latter was comparable (p˃0, 05) to rations R25. The R75 diet gave the highest value but comparable (p˃0, 05) to that of the R0 and R50 values.
Table 2. Values of zoo technical characteristics according to the substitution rate of fishmeal by Lima bean flour| Parameters | R 0 | R 25 | R 50 | R 75 | R 100 |
|---|---|---|---|---|---|
| In | 60±0 | 60±0 | 60±0 | 60±0 | 60±0 |
| Fn | 57.5±1.50 | 58±1.00 | 56±1.50 | 58±0.50 | 59±0.50 |
| Wg (g) | 20.25±0.44b | 18.56±0.4b | 20.64±0.32b | 20.98±0.46b | 16.21±0.28a |
| ADG (g) | 0.36±0.02b | 0.33±0.01a | 0.37±0.01b | 0.38±0.01b | 0.29±0.01a |
| SGR (%) | 2.33±0.07b | 2.20±0.05b | 2.47±0.1b | 2.51±0.45b | 1.61±0.04a |
| K | 0.99±0.38a | 1.01±0.43a | 1.11±0.49a | 0.96±0.38b | 0.95±0.45b |
| CI | 3.31±0.37b | 3.63±0.52b | 3.47±0.43b | 3.68±0.28b | 4.74±0.42a |
Figure 2.Effect of the substitution of fishmeal by Lima bean meal on the weight gain of Clarias
Figure 3.Effect of the substitution of fish meal by bean flour on the average daily gain of Clarias gariepinus
Figure 4.Effect of the substitution of fishmeal by Lima bean flour on the specific growth rate of Clarias gariepinus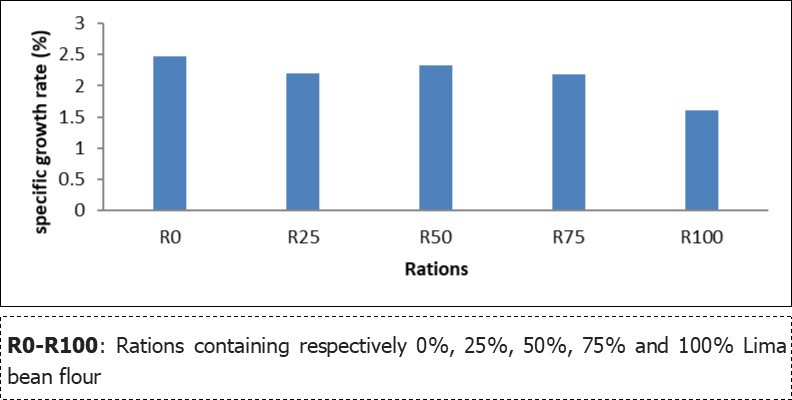
Figure 5.Effect of the substitution of fishmeal by Lima bean meal on the overweight of Clarias gariepinus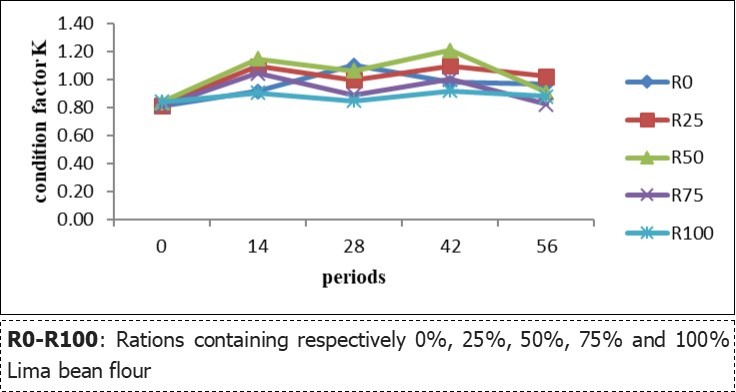
Figure 6.Effect of fishmeal substitution by Lima bean meal on the consumption index of Clarias gariepinus
With respect to the specific growth rate, the values were comparable (p˃0, 05) with the R0 to R75 diets and significantly low with the R100 diet. With regard to the condition factor K, it recorded the values significantly (p˂0.05) higher with the ration R50, R25 and R0 and significantly (p <0.05) lower with the R75 and R100. The opposite trend was observed with the consumption index with R100 having the significantly (p<0.05) higher index value.
Effect of Fish Meal Substitution by Lima Bean Meal on Clarias Gariepinus Weight Gain
The effect of fish meal replacement by Lima bean flour on the weight gain of Clariasgariepinus fry, as shown in Figure 2, shows that the weight gain generally increased over time regardless of the food ration experienced. However, weight gains were significantly greater with the R75 (20.98 ± 0.46g), R50 (20.64 ± 0.32g), R0 (20.25 ± 0.44g) and R25 (18.56 ± 0.40 g) in contrast to the R100 diet which was the lowest value (16.21 ± 0.28 g).
Effect of Fish Meal Substitution with Lima Bean Meal on Average Daily Gain of Clarias Gariepinus Fry
Figure 3 illustrates the effect of fish meal replacement by Lima bean flour on average daily gain in Clariasgariepinusfry. Generally, it appears that the average daily gain increased throughout the study period regardless of the treatment. However, it was significantly (p<0.05) higher with the R0 (0.36 ± 0.02g), R50 (0.37 ± 0.01g) and R75 (0.38 ± 0.01g) rations, while the most less values 0.33 ± 0.01 g and 0.29 ± 0.01 g were obtained with R25 and R100 respectively.
Effect of Fish Meal Replacement by Lima Bean Meal on the Specific Growth Rate of Clarias Gariepinus
The effect of fish meal replacement by lima bean meal on the specific growth rate of Clariasgariepinus(Figure 4) shows that R0 (2.47 ± 0.07%), R25 (2.2 ± 0.05%), R50 (2.33 ± 0.1%) and R75 (2.18 ± 0.45%) were significantly (p˂0.05) higher than the R100 diet (1.61 ± 0.04%) which recorded the lowest value.
Effect of Fishmeal Substitution by Lima Bean Meal on the Condition Factor of Clarias Gariepinus
The effect of the substitution of fishmeal by Lima bean flour on the condition factor K is shown in Figure 5. It is apparent that the overall trend, profile and the pace are comparable between treatments. However, the rations R50 (1.11 ± 0.49), R25 (1.01 ± 0.43) and R0 (0.99 ± 0.38) recorded the significantly (p<0.05) highest values, unlike the 0.96± 0.38 and 0.95 ± 0.45 values of R75 and R100 respectively.
Effect of Fishmeal Substitution by Lima Bean Meal on the Consumption Index of Clarias Gariepinus
The consumption index of Clariasgariepinus, as illustrated in Figure 6, was significantly (p<0.05) affected by the substitution of fishmeal with Lima bean flour. Thus, the lowest index value (3.31 ± 0.37) was recorded in the lots that received the R0 ration followed by R50 (3.47 ± 0.43) and the highest (4.74 ± 0.42) was obtained with R100. This characteristic tends to increase with the level of substitution.
Correlation between the growth Characteristics of Clarias gariepinus and the Physicochemical Parameters of Water
In general, the growth characteristics were not influenced by the physical and chemical parameters of the water, with the exception of the consumption indices of the R0 and R50 diets, which significantly (p˂0.05) were affected by the temperature of the water and the rate of nitrite; and mean daily gain (ADG) that was significantly influenced (p˂0.05) by pH and dissolved oxygen. (Table 3)
Table 3. Correlation between the growth characteristics of Clarias gariepinus and the physicochemical parameters of water| Rations | Growth characteristics | Correlation | ||||
| T(°C) | pH | NO2-(mg/l) | NO3(mg/l) | Oxygen | ||
| R0 | K | 0.351 | 0.163 | 0.773 | -0.026 | -0.903 |
| CI | 0.999* | -0.889 | 0.840 | -0.959 | -0.686 | |
| ADG | 0.639 | -0.169 | 0.938 | -0.353 | -0.994 | |
| weights | 0.371 | 0.143 | 0.785 | -0.047 | -0.911 | |
| R25 | K | -0.087 | -0.574 | 0.423 | 0.423 | -0.201 |
| IC | -0.437 | -0.828 | 0.071 | 0.071 | -0.537 | |
| ADG | 0.765 | 0.985 | 0.341 | 0.341 | 0.834 | |
| weights | 0.292 | -0.225 | 0.731 | 0.731 | 0.181 | |
| R50 | K | -0.941 | 0.988 | -0.848 | -0.779 | 0.628 |
| CI | -0.637 | 0.771 | -1.000* | -0.349 | 0.937 | |
| ADG | 0.357 | 0.174 | 0.513 | -0.643 | -0.766 | |
| weights | 0.995 | -0.996 | 0.693 | 0.908 | -0.419 | |
| R75 | K | -0.995 | -0.894 | -0.893 | -0.056 | -0.138 |
| CI | -0.614 | -0.941 | -0.289 | 0.685 | 0.622 | |
| ADG | 0.165 | 0.667 | -0.201 | -0.949 | -0.919 | |
| weights | -0.941 | -0.976 | -0.756 | 0.189 | 0.108 | |
| R100 | K | 0.520 | -0.024 | 0.854 | -0.155 | -0.024 |
| CI | 0.989 | -0.931 | -0.150 | -0.971 | -0.931 | |
| ADG | 0.866 | -1.000** | -0.499 | -0.991 | -1.000** | |
| weights | -0.971 | 0.961 | 0.241 | 0.989 | 0.961 | |
Financial Evaluation
The economic evaluation of the different rations is summarized in Table 4. It appears that the R100 ration had the lowest production price (443.2 FCFA), followed by R75 (469.48 FCFA) and R50 (487.09FCFA). However, the best value for money was obtained with R75. (Table 4)
Table 4. Evaluation of the cost of different rations| Experimental rations | R0 | R25 | R50 | R75 | R100 |
| Price of a kg of feed | 522.195b | 504.59b | 487.09b | 469.48a | 443.20a |
| Feeding cost of a kg of fish | 1044.39 | 787.16 | 774.47 | 1065.72 | 899.69 |
Discussion
The results show that survival rates were not significantly affected by the different percentages of fish meal substitution by Lima bean flour. This rate varied from 96.5 ± 2.50 to 98.4 ± 2.30%. These results are similar to those obtained by Pouomogne (2013)30 who recorded a maximum survival rate of 96.66% and those of Keremah et al. (2014)18 who obtained a survival rate ranging from 76.7 to 96.7%. They are also similar to those obtained by Lacroix (2004)19 who registered a survival rate ranging from 98 to 100% in Clariasgariepinus in breeding fish ponds. The lack of difference reflects the fact that Lima beans can substitute fishmeal without affecting the survival of fish.
Results on growth characteristics indicated that the weight gain, average daily gain, and specific growth rate of fish fed with the feed containing different levels of Lima bean meal were significantly comparable to those receiving the control diet, with the exception of fish fed with the R100 diet. These results are in accordance with the work of Adeparusi and Olute (2000)2 who evaluated the influence of a food-based diet of Lima bean (80%) in Oreochromis niloticus and found that the diet containing approximately 20% of fish meal gave the best results.They are also similar to those obtained by Ekoué et al., (2013)8 who observed that feed with similar composition gave the best results with substitution rates of 30 and 60% of fish meal by lima bean meal on juveniles of Clariasgariepinus. These similar results may be due to the fact that proteins and other nutritive substances in the lima bean were assimilated by the fry of Clariasgariepinus. However, these results are in contrast with those of Abel et al., (1984)1 who observed that the feed of mirror carp containing 50% of soy bean meal treated with heat replacing half of the fish meal reaches 60 to 65% of growth with feed made from fishmeal.
Moreover, the individual average daily gain registered in the present study (0.35g/day) is higher than that obtained by Gandaho (2007)12, 13 with moringa leaves (0.19g/day) but remains inferior to 0.47g/j as reported by Mouori (2007)24 and to 0,45g/day obtained by Ekoué (2013)8 who substituted fish meal by soy bean meal in juveniles of Clariasgariepinus. This average daily gain is equally ten times inferior to 3g/day obtained by Micha (1974) and Lacroix (2004)19,21 in juveniles of Clariasgariepinusfed with feed grading 40 and 30% protein respectively and raised to 30°C. These results can justified by the environmental conditions of these studies specifically the average temperature which is around 23.01°C.It is the same with the values of the specific growth rate (1.61% to 2.51%) which are greater than 0.04 to 0.18%/day obtained by Pouomogne (1995)29 and to 0.78% reported by Keremah et al.,(2014)18. However, they are inferior 2.90 %/day; 3.4 %/day and 4.14 to 5.80 %/day obtained respectively by Lacroix (2004); Hoffman et al., (1997) and Toko (2007)15, 16, 19 in Clariasgariepinus. The values of the specific growth rate are also inferior3.60%/day as presented (Ekoué, 2013)8 in juveniles of the same species and to the values obtained by Kanangire (2001)17 in the same species. The values obtained by Kanangire (2001) are aound 4.26; 4.05 and 3.85 %/j gotten respectively for feed in Azolla (0%, 30%, and 50%). These low performances may be due to the experimental conditions. In facts, the average temperatures (23.01°C) of our experiment were lower than 27.4°C of Keremah et al, (2014)1, 8. The thermal interval favourable to a better growth of Clarias is around 26 and 30°C (Baras and Jobling, 2002)7. The difference observed can be due to the genetic material used and to the feed quality because is an omnivorous species with a carnivorous tendency.
The condition factor K which gives the overweight of fish varies with the treatment (rations) and was greater than 1 for the R25 and R50reflecting a good weight according to Fulton (1902) who reported that when K>1 it means that the fish has a good weight.In fact, the condition factor K obtained in C. gariepinusin this study was between 0.95 et 1.11. These values are comparable (P> 0,05) to those (0,62 à 1,86) reported by Mlewa et al., (2004)22 in Protopterusaethiopicusand superior to those obtained by par Rukera et al., (2005)31 (0,79 à 0,83% ) in C. gariepinusraised at many density and fed with complete feed or to those reported by Ekoué (2013)8 (0,06 à 0,74). The difference between these values might be due to an optimal use of plant resources in livestock breeding.
Regarding dietary parameters, the consumption index was significantly comparable between the different diets (R0, R25, R50 and R75). However, the consumption index values recorded during the study (3.31 ± 0.37 to 4.74 ± 0.42) are far superior to the values of 1.3 and 1.7 found by Lacroix (2004)19 by feeding fish in floating cages using feed that has 30% crude protein at a density of 100 individuals/m3. Similarly, this index was also higher than that reported by Yakubu et al. (2013)33 at a density of 95 individuals/m3 and at 1.46 registered by Olayini and Salau (2013)25,26 in Clariasgariepinus fed with feed containing maggots meal. In this study, the incorporation of Lima bean flour generally increased ingestion in Clariasgariepinus fry relative to the control diet (R0). This observation makes it possible to assume that the feeds tested were more appreciated by the Clariasgariepinus fry than the R0 control feed though their assimilation has been variable.
The R75 diet represents the best value for money (469.48 FCFA per kg of food purchased and 1065 FCFA obtained per kg of fish sold) and is therefore the most efficient bio economically. This result is in accordance with the works of Ajani et al. (2004)3which show that the substitution of fish meal by maggots meal at 50 and 100% helps to reduce the production cost of a kilogram of fish at about 18 to 28% due to the low cost of ingredients.
Conclusion
At the end of this study on the effect of the replacement of fishmeal with Lima bean flour, aimed at contributing to the development of alternative sources of animal protein the following conclusions were drawn:
The survival rate of Clariasgariepinus fry was not significantly affected by the substitution rate.
Ø However, the highest survival rate was recorded with the lot fed with the R50 ration; all growth characteristics were significantly affected by the substitution rate.
Ø However, it should be noted that the best characteristics were obtained with the R50 ration while the feed containing 75% Lima bean flour is the most bio economically efficient.
In view of the above, the use of the ration substituted by 75% Lima bean increases the growth performance of Clariasgariepinus fry and reduces the cost of food production. However, the influence of Lima bean flour on reproductive parameters and the technological and organoleptic qualities of fish flesh should be examined.
References
- 1.H J Abel, Becker K, Meske C H R, Friedric W. (1984) . , Possibilities of Using Heattreated Full-fat Soya Beans in Carp Feeding”.Aquaculture 42, 97-108.
- 2.E O Adeparusi, B W Olute. (2000) Effects of methionine supplemented toasted lima bean(Phaseoluslunatus)diets on growth of Oreochromis niloticus. 12(3), 89-98.
- 3.Ajani E K C, Nwanna, B O Musa. (2004) Replacement of fishmeal with maggot meal in the diets of Nile tilapia,Oreochromisniloticus. , World Aquaculture 35(1), 52-54.
- 4.V A Aletor, Aladetimi O O. (1989) . Compositional Evaluation of Some Cowpea Varieties and Some Under-utilized Edible Legumes in Nigeria” DieNahrung 33(10), 999-1007.
- 5.O A Alphonsus, Ebere S, Erondu, J O Onyema. (2009) Replacement of fish meal with maggot meal in African catfish. , (Clariasgariepinus) diets,RevistaCientificaUDO Agricola 9(3), 653-656.
- 6.A O, B A Okpako, L C Ugwuowo. (2013) of feeding time on the performance of juvenile african catfish (Clariasgariepinus,Burchell 1822).Online. , Journal of Animal and Feed 3(3), 143-148.
- 7.M Baras E etJobling. (2002) Dynamics of intracohort cannibalism in cultured fish.AquacultureResearch. 33, 461-479.
- 8.C A Ekoué. (2013) Effets de la substitution de la farine de poisson par la farine des graines de Néré (Parkiabiglobosa) et de la farine du tourteau de soja (Glycine maxima) sur la croissance et la survie des juvéniles deClariasgariepinus(Burchell,1822). 42.
- 9.FAO. (2012) Situation Mondiale des Pêches et de l’Aquaculture. Département des pêches et de l’Aquaculture de la FAO. Organisation des Nations Unies pour l’Alimentation et l’Agriculture Rome.
- 10.FAO. (2016) La situation mondiale des pêches et de l’aquaculture ; Département de Pêches et Aquaculture, FAO (Ed). , Rome (Italie) 227.
- 12.P S Gandaho. (2007) Etude des performances de croissance des juvéniles deClariasgariepinus(Burchell, 1822) nourris à base deMoringaoleiferaet de sous-produits locaux. Dissertation présentée en vue de l’obtention du grade de Docteur en Sciences.33p.
- 13.P S Gandaho. (2007) Etude des performances de croissance des juvéniles declariasgariepinus(Burchell, 1822) nourris a base deMoringaoleiferaet de sous-produits locaux. Dissertation présentée en vue de l’obtention du grade de Docteur en Sciences.33p.
- 14.Hishamunda N, Ridler N. (2003) Sustainable commercial aquaculture: a survey of administrative procedures and legal frameworks.Aquaculture Economics and Management. 4, 167-178.
- 15.L C Hoffman, J F Prinsloo, Rukan G. (1997) Partial replacement of fish meal with either soybean meal, brewers yeast or tomato meal in the diets of African sharp tooth catfishClariasgariepinus.Water. , SA 23, 181-186.
- 16.Imorou Toko I. (2007) Amélioration de la production halieutique des trous Traditionnels àpoissons (whedos) du delta de l’Ouémé (sud Bénin) par la promotion de l’élevage des poissons-chatsClariasgariepinusetHeterobranchuslongifilis. Thèse présentée en vue de l’obtention du grade de Docteur en Sciences, Facultés Universitaires Notre-Dame de la Paix Namur-Belgique, Faculté des Sciences. 214.
- 17.C K Kanangire. (2001) Effet de l’alimentation des poissons avec Azolla sur l’écosystème agropiscicole au Rwanda. Dissertation présentée en vue de l’obtention du grade de Docteur en Sciences. Facultés universitaires Notre –Dame de la paix,Namur,Belgique. 220.
- 18.R I Keremah, O A Davies, I D Abezi. (2014) . , Analysis of Fish Pond Water in Freshwater Areas of Bayelsa State, Nigeria. Greener Journal of Biological Sciences 4(2), 33-38.
- 19.Lacroix E. (2004) Pisciculture en zone tropicale. , GFA Terra Systems, Eulenkrug straße Hamburg, Allemagne 82, 22-359.
- 21.J C Micha. (1974) La pisciculture africaine. Espèces actuelles et nouvelles, 163-167, in Ruwet. Zoologieet association technique. Edition Fulreac,Liège. 381
- 22.C M Mlewa, J M Green. (2004) Biology of the marbled lungfish,ProtopterusaethiopicusHeckel, in lake Baringo. , Kenya.Africa Journal of ecology 42, 338.
- 23.Moehl J, R E Brummett, B M Kalende, Coche A. (2006) principles for promoting aquaculture in Africa : benchmarks for sustainable development.CIFA Occasional Paper 28, Food and Agriculture Organization of the United Nations. , Accra, Ghana
- 24.Mouori M G T. (2007) Performance de croissance comparées des juvéniles deClariasjaensisetClariasgariepinus.Mémoire présentée en vue de l’obtention du diplôme d’ingénieur agronome. Université des Sciences et des Techniques de Masuku. 42p .
- 25.C O Olaniyi, B R Salau. (2013) Utilization of maggot meal in the nutrition of. , African catfish.AfricanJournal of Agricultural Research 8(37), 4605-4607.
- 26.C O Olaniyi, B R Salau. (2013) Utilization of maggot meal in the nutrition of African catfish. , African Journal of Agricultural Research 8(37), 4604-4607.
- 27.A D Ologhobo. University of Ibadan (1980) Biochemical and Nutritional Studies of Cowpea and Lima Bean with Particular Reference to Some Inherent Nutritional Factors”.Ph. D Thesis. , Ibadan, Nigeria
- 28.Pouomogne V. (1994) Alimentation du tilapiaOreochromisniloticusen étang : Evaluation du potentiel d’utilisation de quelques sous-produits de l’industrie agro-alimentaire et modalités d’apport des aliments. Thèse de Doctorat d’Halieutique. , ENSA de Rennes,France 101.
- 29.Pouomogne V. (1995) Comparaison du son de riz et du tourteau d’arachide pour la croissance des juvéniles du poisson-chat africainClariasgariepinus.Aquaculture Livingressource. 8, 403-406.
- 30.Pouomogne V. (2013) Growth, Feed conversion, and Nutrient Retention Efficiency of African Catfish,Clariasgariepinus, (Burchell) fingerlings Fed Diet with Varying levels of protein. 303-316.
- 31.Rukera T S, Micha J C, et Ducarne C. (2005) Essais d’adaptation de production massive des juvéniles deClariasgariepinusen condition rurale.Tropicultura. 23(4), 231-234.