
Abstract
Nitrogen leaching as a direct pathway of N loss from agricultural land can negatively affect groundwater and surface water quality. However, a simple and efficient method for nitrogen leaching loss estimation is still inefficient. In this study, an exponential model was developed using the experimental data from a two-year field experiment conducted in the Taihu Lake region of China to simulate the N leaching from the paddy soil. The results showed the leached N was in the range of 5.66 to 8.45 kg N/ha during the whole rice season, which was accounted for 1.7%-2.1% of the applied N. A good agreement between the measured and model predicted results for N leaching loss was observed, suggesting the validity of the established model. The model was further validated with the data of other studies in other regions. The results demonstrated this model is able to simulate the N leaching loss accurately and can provide a beneficial tool for users to predict N leaching loss in paddy soil.
Author Contributions
Academic Editor: Abubaker Haroun Mohamed Adam, Department of Crop Science (Agronomy), College of Agriculture, Bahri University- Alkadaru- Khartoum -Sudan, Sudan.
Checked for plagiarism: Yes
Review by: Single-blind
Copyright © 2019 Wen-Ming Xie, et al.
 This is an open-access article distributed under the terms of the Creative Commons Attribution License, which permits unrestricted use, distribution, and reproduction in any medium, provided the original author and source are credited.
Competing interests
The authors declare that there are no competing financial interests or personal relationships that could have appeared to influence the work reported in this paper.
Citation:
Introduction
Rice is the most important crop in China, which makes up 43.7% of the national grain production 1. The Taihu Lake region (TLR) located in the Yangtze River delta is one of the five major rice production regions in China 2, 3, 4. To achieve high grain yields, farmers in TLR often apply large amount of fertilizers, especially nitrogen (N) fertilizer 5. It is reported that the optimal level of fertilizer N was from 185 kg/ha to 270 kg/ha in TLR, however, the average N fertilizer input was over 350 kg/ha in TLR 6, 7, 8. Therefore, excess N in paddy soils will get lost to surrounding water bodies, and result in eutrophication and groundwater contamination in this region 9.
Leaching is one main pathway of N losses in paddy soil, which normally accounts for 0.1%-4.9% of the applied N 3, 10, 11. The leached N can increase the groundwater nitrate content significantly and deteriorate the groundwater quality seriously 12, 13, 14, 15, 16. Therefore, the N leaching in paddy soil should be controlled effectively. However, to control the N leaching, the amount of leached N should be measured first. At the present time, the amount of leached N is estimated with the volume of leachate and the N concentration in leachate at a certain interval (usually at 7 days or 10 days) during the whole rice growing season 1, 3, 17. Although this method was widely used, it is tedious and time consuming with low efficiency. Therefore, a more efficient method is necessary to overcome those shortcoming.
Mathematical modeling has been proven to be a powerful tool in predicting N losses 18, 19, 20, 21, 22. At present, most mathematical models concerned on N leaching from agricultural lands are mainly focused on dryland, such as the Nitrogen Leaching and Economic Analysis Package (NLEAP) program 18, 23, 24, HYDRUS-1D/2D/3D model 25, 26 and LEACHA/N model 27. However, the soil physiochemical property of dryland is substantially different from the flooded paddy soils. First, the paddy soil is under water-saturated state in most of the growing season while dryland is under water deficient state in most of the time, which affects the N-transformation processes and movement in soil 20, 28, 29. Second, the nitrogen amount and forms in leachates are different between dry lands and paddy soil. Ammonium-N (NH4-N), NO3-N and organic N are the main forms in the leachate of paddy soil while NO3-N is the dominant form in dryland leachate 1, 3, 17. Third, there is a more distinct plow pan in paddy soil, which changes the water downward movement and distinguishes it from dryland 28. Therefore, different model should be developed to simulate the N leaching process in flooded paddy soil.
Rao et al. 30 has developed the NFLOOD model to simulate the N leaching process in paddy soil. Zhao et al. 31 used the modified DeNitrification DeComposition (DNDC) model to simulate the N leaching process in paddy soil. However, these models are over-parameters. Too many parameters in these models will increase the uncertainty of model results and constrain the application of these models. Liang et al. 20 has developed a simple model for paddy soil, however, this model has not taken ammonium-N and organic N into consideration in leachate, which will underestimate N leaching loss from paddy soil, since ammonium-N and organic N are important parts of N in leachate, which is accounted for more than 40% of total N 1, 3, 17.
Therefore, the objective of this study was to quantify N leaching losses in a paddy soil in TLR for 2 consecutive years. Then, a simple and efficient model as a predictive tool for nitrogen leaching in the TLR was developed and calibrated with additional data. Hopefully, this study can provide an effective tool for N leaching estimation in paddy soil.
Materials and Methods
Study Area and Rice Field Plot Experiment
The field experiment was conducted at the Yixing city of Jiangsu province near the Taihu Lake (31°16´ N, 119°54´ E) from 2013 3. The area is characterized by a subtropical monsoon climate, with an average temperature of 15.7°C and an annual rainfall of 1177 mm. The paddy soil is consisted by 8.3% sand, 81.5% silt, and 10.2% clay 3. The pH of the soil was 5.6. The soil contained 15.4 g/kg organic C, 1.79 g/kg N, and had a cation exchange capacity (CEC) of 11.8 cmol/kg. A summer rice-winter wheat crop rotation has been practiced for over 50 years at the site.
The experimental plots were arranged randomly with 3 N treatments and 3 replications with individual plot 44 m2. The 3 N treatments were as follows: N0 (control, 0 kg N/ha), N1 (220 kg N/ha) and N2 (270 kg N/ha), in which N2 was the local treatment. Urea was used as the source of N with 40% basal applied prior to transplanting, 30% top dress at the tillering stage, and the remaining 30% top dress at the ear differentiation stage. Phosphorous (P) and potassium (K) fertilizers were applied basally in the form of superphosphate at a rate of 60 kg P2O5/ha and in the form of KCl at a rate of 45 kg K2O/ha. All fertilizers were surface applied. Local cultivation and field management practices were adopted 3. Floodwater was mostly maintained at a depth of 3 to 5 cm above the ground surface in the field except for the midseason aeration and final drainage periods. The midseason aeration lasted for 7–10 days during the mid-term of rice season when there was no standing water on soil surface. After this, the field was flooded again until the end of rice season when all floodwater was discharged.
Sampling and Analysis
Percolation water was collected at 40 cm, 80 cm, and 120 cm soil depth in each N treatment with a vacuum pump at 7-day to 10-day intervals during the rice season as described in Zhao et al 3 study. After sampling, percolation water sample was immediately frozen without filtering at -20 oC in a freezer until analysis. Concentrations of NH4-N, NO3-N and total N (TN) in water samples were analyzed with a continuous-flow N analyzer (Skalar, Netherlands).
The total volume of leached water during the rice season is defined as the rate of surface water vertical percolation (mm/day) × flooded periods (day) × plot area. The average leaching rate of 2 mm/day measured in previous study was adopted in this study 3.
Exponential Model Development
To minimize the influence of root growth and underground water on N leaching loss calculation, we used the TN concentration of percolation water extracted at 120 cm soil depth for N leaching loss estimation.
First, the N leaching loss at each sampling time was calculated by Equation (1):
Ni= vertical leaching rate × sampling time interval ×TN concentration×10-2 ……..(1)
Where Ni is N leaching loss (kg N/ha), vertical leaching rate was 2 mm/d, sampling time interval (days), TN concentration (mg/L).
Then, the N leaching loss ratio of each sampling relative to the cumulative loss was calculated by Equation (2):
Pi = Ni/
….(2)
Where Pi is the N leaching loss ratio of each sampling (%), i is the sampling times (i=1, 2, 3… 15).
Then, the cumulative N leaching loss ratio up to the ith sampling was calculated by Equation (3):
Cumulative N leaching loss ratio (%) =

….. (3)
Where n is the total sampling times.
Finally, an exponential model was fitted to the N leaching process (Equation 4).
Y=a - be-t/k …….(4)
Where Y is the cumulative N leaching loss ratio, t is the time after basal N fertilizer application (d), a, b and k are constant.
Results
Characteristic Variations of N Leaching in Relation to Fertilization and Soil Depth During Rice Season
With the increase of urea application, N concentrations in leachates were increased significantly (Figure 1). The NH4-N concentration at 40 cm soil depth was increased from 0.3 mg/L to 8.4 mg/L and 7.3 mg/L respectively when 220 kg N/ha and 270 kg N/ha urea were applied. Accordingly, the peaks of NH4-N concentration at 80 cm and 120 cm soil depths were 2.6 mg/L, 4.2 mg/L and 2.0 mg/L, 4.9 mg/L respectively at 8 days after urea was applied. The NO3-N concentrations at all three soil depths were increased gradually with time, and peaked at 29 days after urea was applied. The highest NO3-N concentration in samples collected at 40 cm, 80 cm and 120 cm soil depths were 7.8 mg/L, 10.2 mg/L, 4.8 mg/L with 220 kg N/ha input and 17.0 mg/L, 17.0 mg/L, 13.4 mg/L with 270 kg N/ha input, respectively. The TN concentrations peaked at 7 days and 29 days after urea application. The highest TN concentrations in 40 cm, 80 cm and 120 cm soil depths were 18 mg/L, 11.2 mg/L, 6.2 mg/L respectively with 220 kg N/ha input and 18.9 mg/L, 19.6 mg/L, 10 mg/L with 270 kg N/ha input. The organic N concentrations at 40 cm, 80 cm and 120 cm soil depths were also increased first and then decreased, which accounted for 25%, 17% and 10% of total N losses on average 3, 17. This demonstrates that organic N is an important component in total N, which should be taken into consideration during N leaching modeling and estimating.
Figure 1.Variation of N concentrations in percolation water over time from different soil depths from the paddy soil in 2013 rice season (A, B, C without urea; D, E, F with 220 kg N/ha urea; G, H, I with 270 kg N/ha urea). The arrow denotes the time of N fertilization.
The N concentrations were generally decreased with the increase of soil depth. The average NH4-N concentration was decreased by 0.6 mg/L when soil depth was increased from 40 cm to 120 cm. At the same time, the average NO3-N and TN concentrations were decreased about 1.1 mg/L and 2.3 mg/L respectively as the depth increased from 40 cm to 120 cm. The N concentrations of the percolation water collected at 40 cm soil depth varied significantly, while they were stable at 120 cm. The N concentrations in the percolation water showed similar trend in 2013 and 2014 rice season (2013 data not shown).
The estimation of N leached at 120 cm depth were 5.66 to 8.45 kg N/ha during two rice seasons (Table 1), which is consistent with other studies 3, 17. The results showed N leaching from paddy soil in TLR was not high, which might be attributed to the low permeability of the puddled layer in this region.
Table 1. Accumulated leaching of N through percolation water| Year | Treatment | NH4-N(kg N/ha) | NO3-N(kg N/ha) | TN(kg N/ha) | Loss Percentage (%) |
| 2013 | N0 | 1.03±0.8 | 1.04±0.62 | 2.83±1.81 | - |
| N1 | 2.75±1.27 | 3.06±1.38 | 6.79±3.82 | 1.8 | |
| N2 | 4.41±2.44 | 3.34±2.07 | 8.45±3.78 | 2.1 | |
| 2014 | N0 | 0.64±0.23 | 1.22±0.71 | 2.03±1.02 | - |
| N1 | 1.59±0.9 | 3.44±1.45 | 5.66±2.76 | 1.7 | |
| N2 | 2.88±1.72 | 3.59±2.21 | 7.04±2.81 | 1.9 |
Model Calibration
We used the developed model to simulate the N leaching loss from the paddy soil. The N leaching loss data collected in 2013 field experiments was used for model development.
As shown in Figure 2, the N leaching data fits well with the exponential model (Y=140.584 -137.325*e^(-t/97.18)) (R2=0.98). After basal urea application, the N leaching loss rate decreased with time 20. The initial N leaching loss rate was about 3.3 times of that at the end of rice season. Since the summer rice-winter wheat crop rotation had been practiced for many decades in TLR, the leaching rate was fast in the early rice season and slowed down with time as the subsoil become saturated 20. Two main reasons were responsible for the phenomenon. First, the puddled soil layer is saturated with water and results in low permeability after the field is flooded. Second, rice plants continuously utilize N and reduce N concentration in water subjected to leaching 32, 33.
Figure 2.The measured and simulated cumulative N loss ratio in the 2013 rice growing season
Model Validation
We validated the model using the 2014 rice season N leaching loss data. A good agreement between the measured and model predicted results was observed (Figure 3), suggesting the validity of the established model.
Figure 3.Model validation with the 2014 rice growing season N leaching loss data
After validation with our data, we further validated the developed model with N leaching loss data from other studies in nearby regions in Jiangsu Province (Table 2). The results showed the difference between the simulated and measured N leaching loss was less than 20% (Figure 4).
Table 2. The N leaching data used for model validation in Jiangsu Province| Source | N application rate(kg N/ha) | Experiment year | Soil depth (cm) |
| Zhu et al. 35 | N1 (200)N2 (250)N3 (300) | 1996 | 90 |
| Tian et al. 17 | N1 (180)N2 (255)N3 (330) | 2002-2004 | 90 |
| Wang et al. 36 | N1 (225)N2 (300) | 2001-2003 | 90 |
| Zhang et al. 37 | N1 (360) | 2006 | 100 |
| Li et al. 38 | N1 (220) | 2008 | 100 |
| Yu et al. 39 | N1 (210)N2 (270) | 2009-2010 | 100 |
| Zhao et al. 40 | N1 (300) | 2007-2009 | 100 |
| Zhao et al. 3 | N1 (81)N2 (135)N3 (189)N4 (216)N5 (243)N6 (270) | 2011 | 100 |
| Chen et al. 41 | N1 (200)N2 (270) | 2011 | 120 |
| This study | N1 (220)N2 (270) | 2013-2014 | 120 |
Figure 4.Model validation with leaching N loss ratio data from other studies in Jiangsu Province in west of Taihu Lake region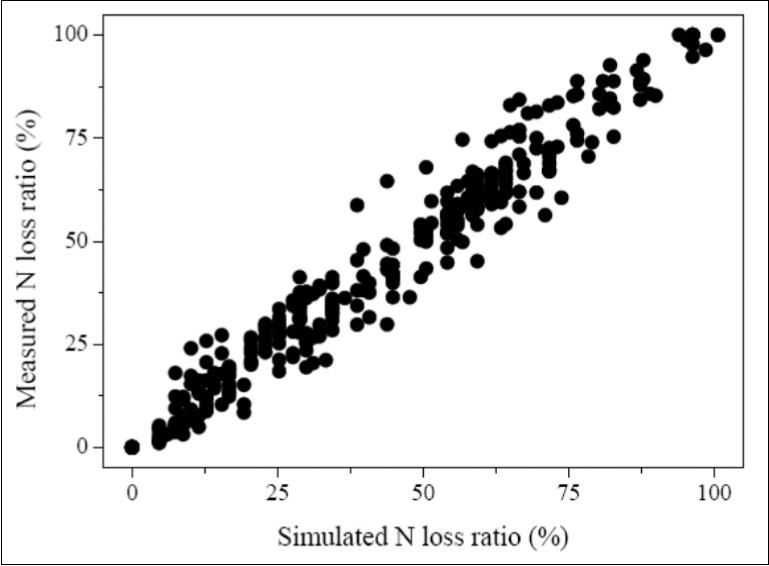
We also applied the developed model to simulate the N leaching loss process in other regions (Figure 5). The simulated N leaching losses only differed the measured data in Wang et al. 42 in the range of 3%-49%, with an average of 20.8% (Figure 6A). Lack of organic N leaching data and different soil property in Wang et al. 42 might be the main reason for this deviation. We found our model could simulate the N leaching process well in Shanghai region as well 43. The deviation of measured and simulated N leaching data was in the range of 0.3%-13%, with an average of 6.5% (Figure 6B). These successful model verifications further demonstrate that the developed model is able to accurately simulate the N loss process in paddy soil.
Figure 5.The experiment location of our study and Wang et al. 42 study in Shanghai (A) and Ye et al. 43 study in Zhejiang Province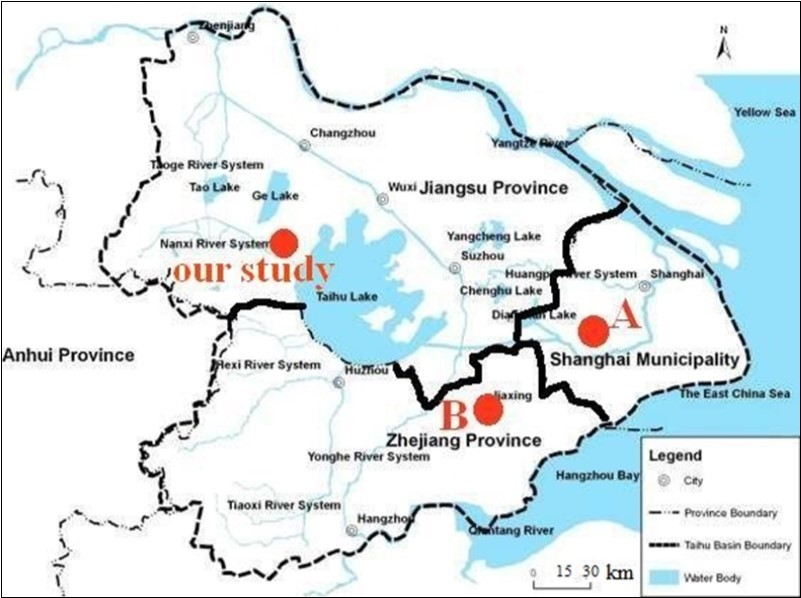
Figure 6.Model validation with leaching N loss ratio data from other studies 4243
Discussion
Nitrogen leaching loss is one of the main pathways for N loss in paddy soil 3, 10, 11, 14, 15. The leached N can deteriorate the groundwater quality. At the same time, it can also decrease the N fertilizer utilization efficiency. Therefore, it is necessary to monitor the N leaching process and determine the amount of N leached so that better management practices can be identified and promoted.
Compared with other simple models, such as models developed in Chowdary et al. 34 study and Liang et al. 20 study, our model has the highest accuracy of N leaching loss estimation. But, compared with other professional model, such as De Nitrification De Composition (DNDC) 31, the accuracy of N leaching loss estimation by our model is a bit lower. However, these models need many essential data, such as daily meteorological data, soil properties and agricultural management practices as input data before simulation. Furthermore, some important parameters related with leaching process should be first calibrated by professional operator during simulation process. All these will increase the use difficulty of these models. Thus, the simple and efficient model developed in this study are welcome by local government and farmers, who don’t need too professional knowledge and skill to calculate the N leaching.
Furthermore, the findings of this study can help address two questions regarding N leaching process. Firstly, how is the N leaching rate changed during rice growing season? We found that the N leaching rate was high in the early stage of rice growth. Then, the N leaching rate decreased with time. Thus, in order to reduce the N leaching loss, less N should be applied during the initial planting time. Secondly, how many sampling times are necessary to accurately determine the amount of leached N? High frequency of sampling would increase the accuracy of results, but it consumes too much time and labor. By using the developed model, we found the N leaching loss can be calculated only through 4 times sampling which could reduce the expenses of data collection significantly. This can increase the efficiency of leaching N research in TLR and other regions with similar environmental conditions and management practices.
Conclusions
In this study, an exponential model was developed to simulate N leaching loss from the paddy soil in the Taihu Lake region (TLR) of China by using the N leaching data from a two-year field experiment. The model was successfully validated with different data from the same region and from nearby regions to accurately simulate N leaching loss. This model is proven to be simple and efficient to predict N loss from paddy soil.
Acknowledge
This study was financially supported by the National Natural Science Foundation of China (No. 51778301), the Key Special Program on the S&T for the Pollution Control (2017ZX07202004), the Postgraduate Research & Practice Innovation Program of Jiangsu Province (KYCX18_1246) and the Special Environmental Research Fund for Public Welfare of the State Environmental Protection Administration of China (201309035).
References
- 1.Qiao J, Yang L Z, Yan T M, Xue F, Zhao D. (2013) Rice dry matter and nitrogen accumulation, soil mineral N around root and N leaching, with increasing application rates of fertilizer. , Eur J Agron 49, 93-103.
- 2.Ju X T, Xing G X, Chen X P, Zhang S L, Zhang L J et al. (2009) Reducing environmental risk by improving N management in intensive Chinese agricultural systems. , P Natl Acad Sci USA 106, 3041-3046.
- 3.Zhao X, Zhou Y, Min J, Wang S Q, Shi W M et al. (2012) Nitrogen runoff dominates water nitrogen pollution from rice-wheat rotation in the Taihu Lake region of China. Agr Ecosyst Environ. 156, 1-11.
- 4.Lian Z M, Ouyang W, Hao F H, Liu H B, Hao Z C et al. (2018) Changes in fertilizer categories significantly altered the estimates of ammonia volatilizations induced from increased synthetic fertilizer application to Chines rice fields. Agr Ecosyst Environ. 265, 112-122.
- 5.Zhu Z L, Chen D L. (2002) Nitrogen fertilizer use in China-Contributions to food production, impacts on the environment and best management strategies. , Nutr Cycl Agroecosys 63, 117-127.
- 6.Lin D X, Fan X H, Hu F, Zhao H T, Luo J F. (2007) Ammonia volatilization and nitrogen utilization efficiency in response to urea application in rice fields of the Taihu Lake Region. , China. Pedosphere 17, 639-645.
- 7.Wang D J, Liu Q, Lin J H, Sun R J. (2004) Optimum nitrogen use and reduced nitrogen loss for production of rice and wheat in the Yangtse Delta region. , Environ Geochem Hlth 26, 221-227.
- 8.Xia Y Q, Yan X Y. (2011) Economic optimal nitrogen application rates for rice cropping in the Taihu Lake region of China: taking account of negative externalities. , Biogeosciences 8, 6281-6305.
- 9.Wang M R, Strokal M, Burek P, Kroeze C, Ma L et al. (2019) Excess nutrient loads to Lake Taihu: Opportunities for nutrient reduction. Sci Total Environ. 664, 865-873.
- 10.Berlin M, Kumar G S, Nambi I M. (2014) Numerical modeling on transport of nitrogen from wastewater and fertilizer applied on paddy fields. , Ecol Model 278, 85-99.
- 11.Riya S, Zhou S, Kobara Y, Sagehashi M, Terada A et al. (2015) Influence of nitrogen loading and plant nitrogen assimilation on nitrogen leaching and N2O emission in forge rice paddy fields fertilized with liquid cattle waste.Environ Sci Pollut R. 22, 5762-5771.
- 12.Benoit M, Garnier J, Billen G, Tournebize J, Grehan E et al. (2015) Nitrous oxide emissions and nitrate leaching in an organic and a conventional cropping system (Seine basin, France). Agr Ecosyst Environ. 213, 131-141.
- 13.Nakasone H. (2009) Effect on water quality in irrigation reservoir due to application reduction of nitrogen fertilizer. , Paddy Water Environ 7, 65-70.
- 14.Thomas D, Johannes K, David K, Rudiger G, Ralf K. (2016) Impacts of management and climate change on nitrate leaching in a forested karst area. , J Environ Manage 165, 243-252.
- 15.Williams M R, King K W, Fausey N R. (2015) Contribution of tile drains to basin discharge and nitrogen export in a headwater agriculture watershed. Agr Water. Manag.158: 42-50.
- 16.Xing G X, Cao Y C, Shi S L, Sun G Q, Du L J et al. (2001) N pollution sources and denitrification in waterbodies in Taihu Lake region. , Sci China 44, 304-314.
- 17.Tian Y H, Yin B, Yang L Z, Yin S X, Zhu Z L. (2007) Nitrogen runoff and leaching losses during rice-wheat rotations in Taihu Lake region. , China. Pedosphere 17, 445-456.
- 18.Ersahin S, Karaman M R. (2001) Estimating potential nitrate leaching in nitrogen fertilized and irrigated tomato using the computer model NLEAP. , Agr Water Manag 51, 1-12.
- 19.Figueroa-Viramontes U, Delgado J A, Cueto-Wong J A, Nunez-Hernandez G, Reta-Sanchez D G et al. (2011) A new Nitrogen Index to evaluate nitrogen losses in intensive forage systems in Mexico. Agr Ecosyst Environ. 142, 352-364.
- 20.Liang X Q, Chen Y X, Li H, Tian G M, Ni W Z et al. (2007) Modeling transport and fate of nitrogen from urea applied to a near-trench paddy filed. , Environ Pollut 150, 313-320.
- 21.Zhang H X, Sun B, Xie X L, Zhuang S Y. (2015) Simulating the effects of chemical and non-chemical fertilization practices on carbon sequestration and nitrogen loss in subtropical paddy soils using the DNDC model. Paddy Water Environ.13:. 495-506.
- 22.Zhao Z G, Qin X, Wang E L, Carberry P, Zhang Y H et al. (2015) Modeling to increase the eco-efficiency of wheat-maize double cropping system. Agr Ecosyst Environ. 210, 36-46.
- 23.Delgado J A, Shaffer M J, Lal H, Mckinney S P, Gross C M et al. (2008) Assessment of nitrogen losses to the environment with a Nitrogen Trading Tool (NTT). , Comput Electron Agr 63, 193-206.
- 24.Rimski-Korsakov H, Rubio G, Lavado R S. (2004) Potential nitrate losses under different agricultural practices in the pampas region. , Argentina. Agr Water Manag.65: 83-94.
- 25.Rajmohan N, Elango L. (2007) Mobility of major ions and nutrients in the unsaturated zone during paddy cultivation: a field study and solute transport modeling approach. Hydrol Process. 21, 2698-2712.
- 26.Lai X M, Li Y, Zhou Z W, Zhu Q, Liao K H. (2019) Investigating the spatio-temporal variation of nitrate leaching on a tea garden hillslope by combining HYDRUS-3D and DNDC models. , J Plant Nutr Soil Sc 1-12.
- 27.Hutson J L, Wagenet R J. Cornell Univ (1992) LEACHN: Leaching estimation and chemistry model-a process-based model of water and solute movement, transformations, plant uptake and chemical reactions in the unsaturated zone. Research series 92-3. Dep. Soil, Crop , Ithaca, NY .
- 28.Chen S K, Liu C W. (2002) Analysis of water movement in paddy rice fields (I) experimental studies. , J Hydrol 260, 206-215.
- 29.Garg K K, Das B S, Safeeq M, PBS Bhadoria. (2009) Measurement and modeling of soil water regime in a lowland paddy field showing preferential transport.Agr Water Manag. 96, 1705-1714.
- 30.PSC Rao, Jessup R E, Reddy K R. (1984) Simulation of nitrogen dynamics in flooded soils. , Soil Science 13, 54-62.
- 31.Zhao Z, Zhang H L, Li C S, Zhao Q, Cao L K. (2014) Quantifying nitrogen loading from a paddy field in Shanghai, China with modified DNDC model. Agr Ecosyst Environ. 197, 212-221.
- 32.Lea P J, Azevedo R A. (2006) Nitrogen use efficiency. 1. Uptake of nitrogen from the soil. , Ann Appl Biol 149, 243-247.
- 33.Shi W M, Xu W F, Li S M, Zhao X Q, Dong G Q. (2010) Responses of two rice cultivars differing in seedling-stage nitrogen use efficiency to growth under low-nitrogen conditions. , Plant Soil 326, 291-302.
- 34.Chowdary V M, Rao N H, PBS Sarma. (2004) A coupled soil water and nitrogen balance model for flooded rice fields in India. Agr Ecosyst Environ.10:. 425-441.
- 35.Zhu J G, Han Y, Liu G, Zhang Y L, Shao X H. (2000) Nitrogen in percolation water in paddy fields with a rice/wheat rotation. Nutr Cycl Agroecosys.57:. 75-82.
- 36.Wang X Z, Zhu J G, Gao R, Yasukazu H, Feng K. (2007) Nitrogen cycling and losses under rice-wheat rotations with coated urea and urea in the Taihu Lake region. , Pedosphere 17, 62-69.
- 37.Zhang J, Wang D J, Wang C. (2008) Nitrogen and phosphorous balance under paddy field irrigation-drainage system in south Jiangsu plain. (In Chinese) , Acta Pedol Sinica 45, 657-662.
- 38.Li Y, Yang L Z, Yin G D. (2010) Experimental study on nitrogen leaching in a direct-seeding rice paddy of Taihu Lake basin. Plant Nutri Fert Sci.16: 99-104. (In Chinese).
- 39.Yu Y L, Xue L H, Yang L Z. (2014) Maintaining yields and reducing nitrogen loss in rice-wheat rotation system in Taihu Lake region with proper fertilizer management. , Environ Res Lett 9, 115010.
- 40.Zhao D, Yan T M, Qiao J, Yang L Z, Lv H. (2012) Characteristics of N loss and environmental effect of paddy field in Taihu area. (In Chinese) , Ecol Environ Sci 21, 1149-1154.
- 41.Chen G, Chen Y, Shi W M. (2013) Effect of fertilizer N on N leaching at different soil depths during growth periods of rice. (In Chinese) , Soil 45, 809-814.