Abstract
Rapid analyses methods for the assessment of soil microbiota are lacking. In a commercial farm tomato plants were subjected to different fertilization strategies: 1. mineral Control (C); 2. Organic amendment (O); 3. Organic amendment + Micosat F © biofertilizer (OM). A first rapid method (Litterbag-NIRS) concerned hay litterbags coupled with a smart SCiOTM device. A second method (Foliar-NIRS) used the same device on the leaves. The plants showed positive responses to the amendment and biofertilization in the yield: C 60.5.1 t ha-1vs. 70.8 in O (+17%) and 74.2 in OM (+23% from C and + 5% (P 0.08) from O). The use of Litterbag-NIRS fingerprinting, completed with litterbags phenotyping and elaborated with a multivariate support vector machine classifier provided a similar knowledge to that obtained from microbial and chemical analyses of the soil. The reason for this response is that the analyses were embedded in the Litterbag-NIRS at medium-high precision. A polydromic function was hypothesized in order to disentangle the activities of different soil microbial populations from each other. The organic amendment delayed the functionality of the rapid r-strategist microbial populations, but at the same time activated slow k-strategists to intake the walls of the hay inside the litterbags. In this sense, the Litterbag-NIRS test can provide an effective “swamp” of the microbial fertility of the soil. Briefly, the Litterbag-NIRS coupled with Foliar-NIRS accounted for 95% of the average yield results, and both are therefore recommended for a rational assessment of microbial soil fertility.
Author Contributions
Academic Editor: Abubaker Haroun Mohamed Adam, Department of Crop Science (Agronomy), College of Agriculture, Bahri University- Alkadaru- Khartoum -Sudan.
Checked for plagiarism: Yes
Review by: Single-blind
Copyright © 2020 Elena Baldi, et al.
 This is an open-access article distributed under the terms of the Creative Commons Attribution License, which permits unrestricted use, distribution, and reproduction in any medium, provided the original author and source are credited.
Competing interests
The authors have declared that no competing interests exist.
Citation:
Introduction
Soil fertility, usually defined as the ability of a soil to promote plant growth and yield by integrating different soil functions1including nutrient availability, microbial activity and physical properties is fundamental for determining the productivity of all farming systems. Consequently, the knowledge of chemical, physical, and biological properties of a given soil is fundamental to reach a high standard production. Chemical parameters of the multifaceted soil fertility can be predicted approximately through an NIRS examination of samples in laboratory2,3,4or directly in a field in a precision agriculture framework5. However, information on chemical fertility is useless if it is not combined with the knowledge of the microbial fertility of the cultivated soil. Increasing interest in microorganisms, such as endophytes, symbionts, pathogens and plant growth promoting rhizobacteria, was observed in the literature, while less attention was paid to the larger community of soil microorganisms, or soil microbiome, which may have more far-reaching effects. Each organism in the community of soil microorganisms acts in coordination with the overall soil microbiome to influence plant health and crop productivity6.
The use of litterbags is a technique that has long been adopted in soil studies on the evolution of microfauna in the bulk soil7. However, there is still a lack of rapid measurement techniques that can assess the microbial status of cultivated soils. The integrated use of NIRS and litterbag techniques could be a functional and rapid solution, as demonstrated by the fact that a change caused by a biofertilizer is reflected in the biochemical functioning mechanisms, and that such a change can be easily testified8. The coupled use of these two techniques (intended as a quality evolution of the litterbags swamps and not as mass decay), can be modeled as a valid fingerprinting of the studied field conditions, a process that results in data validation and predictive models (such as the random forest model algorithm). Furthermore, this combination technique could be used as a rapid and cost-efficient method, especially when compared with more complex methods, such as molecular metabarcoding, which is time consuming and expensive, as well as requiring a great deal of knowledge for the data analysis9.
Rapid predictors of yield are necessary tools to advance biofertilizer tuning and management. Classic microscopic techniques are usually necessary for arbuscular mycorrhizal (AM) studies in this sector10 and were recently improved through molecular techniques thanks to semi-automated digital image analyses, that are used to measure root length and fungal hyphae of dense mycelia11. However, fungal-plant phenotypes are only weakly related or even not related to yield. For example, the correlation between AM and yield in fifteen species grown in pots, after elimination of leeks as an outlier, shifted from +0.60 (P ≤ 0.018) to -0.16 (P ≤ 0.58)12. In a study on potato, treated twice with four commercial AM (Rizophagusirregularis) inoculants13, root length colonization was measured 120 days after planting, and a correlation between root length and yieldof +0.31 (P ≤ 0.18) was observed.
In a two-year project based on maize field trials14 it was concluded that just a few rapid NIRS analyses of litterbags and leaves, together with foliar pH measurements, are able to explain over 87% of the variation in yield from biofertilized or non-biofertilized fields. Validation of the spectroscopic and foliar pH model was carried out on a different biofertilized cultivar, which provided five AM sources. The yield results expressed negative symbiosis effects, and a tendential negative response to bio-fertilizers was correctly predicted in 84% of the cases in the negative quadrant (P ≤ 0.0012). The results of the rapid analyses were confirmed to be correlated to maize quality15 and to potato yield16.
The aims of the present experiment are to confirm the Litterbag-NIRS and the Foliar-NIRS methods in a different species under soil microbial enrichment, and to search spectral correlation with biochemical parameters of the soil and with the phenotype of the litterbags in order to extend the "model learning" of the statistical analyses applied to soil microbial fertility.
Experimental Procedure
A field trial, aimed to evaluating the response of tomato plants to a regeneration of the mineral soil (C), as a result of using an organic amendment (O), and by adding a biofertilizer complex with a mycorrhizal source (OM), was conducted in an over utilized soil. The Litterbag-NIRS method was used, together with chemical analyses, to testify, by means of fingerprinting, the microbiological activities of the treatments in the electromagnetic spectra.
Material and Methods
Site Description and Treatments
The trial was conducted on a commercial farm in the Padana Plain (44°35′19″N 12°00′43″E) on the Heinz 1301 tomato cultivar. Plantlets were transplanted at the third-fourth true leaf stage on April 17, 2018 and grown in a double row with a distance between plants of 40 cm in the row, for a total 33000 plants ha-1 in a plot where tomato was also grown in 2017.
The soil in which the experimentation was carried out was characterized by a clayey-silty texture and was plowed during the winter. Before transplanting, 800 kg ha-1 of organic amendment (40% P2O5; 3% Organic N; 4% K2O; 4% organic C; 26% fulvic acid; 9% humic acid; 10% SO3, 1% Mn; 1% Mg) and 2 q ha-1 of an organo-mineral fertilizer (10% N; 12% P2O5; 7% K2O; 2% MgO; 16% SO3; 0,5% Fe; 0.01% Zn; 0.1% B; 7,5% organic C; 3% humic + fulvic acid) were applied; 10 days after transplanting, 1.8 q ha-1 calcium nitrate (15% N; 26% Ca O) was supplied.
During the experiment, the following fertilization strategies were compared.
C - mineral fertilization: supplied, by fertigation, at transplanting and 4 times during the season for a total 138 kg N ha-1; 107 kg P2O5 ha-1, 110 kg K2O ha-1;
O - organic fertilization: supply patented by Demetra Italia S.R.L, organic fertilizersa,b applied by fertigation at transplanting and 6 times during the season for a total of 74.5 kg N ha-1; 62 kg P2O5 ha-1, 47 kg K2O ha-1:
OM - organic fertilization + Micosat (M): at transplanting, plantlets were dunked for 3 hours in a Micosat-MOc (5 kg ha-1) + Nutribacterd (2 kg ha-1) solution. In addition, the Micosat MO was fertigated 3 times at 2 kg ha-1, The plants were fertilized as described for O.
a Soltermax P (an activator of the rhizospheric biota): a yeast extract with humic substances, fulvic acids, adhesion promoters N and P; Composition : water soluble nitrogen (N) 5 %, organic nitrogen (N) 0.7%, P2O5 15%, organic carbon (C) 9%.
b Vegater (an activator of the rhizospheric biota): yeast extract with humic substances, fulvic acids, essential vegetal AA; Composition : organic nitrogen (N), 2 %, organic carbon (C) 24%.
c Micosat MO (composition per 100 g): 10 g of finely ground cultivated Sorghum sudanensis roots, containing spores and ifae of Funneliformiscoronatus GO01 and GU53, F. caledonium GM24, F. intraradices GB67 and G32, F.mosseaeGP11 and GC11, F. viscosum GC41; saprotrophic fungi: Streptomyces spp. ST60, Streptomyces spp. SB14, Streptomyces spp. SA51, Beauveria spp. BB48, Trichoderma viride, Trichoderma harzianum TH01, Trichoderma atroviride TA28, Trichoderma spp.; rhizosphere bacteria: Bacillus subtilis BA41, Pseudomonas fluorescens PN53, Pseudomonas spp. PT65 and Pochoniachlamidosporia, in a relative percentage of 40% crude inoculum and 21.6% bacteria and saprotrophic fungi.
dNutribacter: bacterial multiplying activator; Composition Nitrogen (N) organic soluble in water 3 %; Organic carbon (C) 15%
A row was used for each treatment for sample collection and 4 blocks in each row were defined in order to obtain replicates.
Litterbag Set Up and Properties
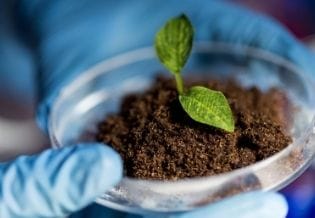
One month after transplanting, 12 litterbags per treatment were buried at a depth of 10 cm (Figure 1). Each litterbag was filled with hay for small animals (“Vita Verde Small Animal Alpine Hay”, by Vitakraft pet care GmbH & Co. KG, Bremen, Germany) ground to 3 mm. About 3.5 g of hay was packed into half empty 10x10cm square polypropylene nets (1.5 mm mesh), which were resealed using 4 staples, and a plastic label was added for identification and for easiness of finding purposes. Four litter bags from each treatment were picked in two periods, at 56 days (A) and at 92 days (B), dried at a mild temperature, gently cleaned and preserved at room temperature until delivery. The brushed litterbags were opened and the surfaces of both sides were examined, in reflectance mode, through a magnetic spacer capsule, measuring 9*40 mm, of a smart miniaturized NIRS web-based wireless spectrophotometer (SCiO v. 1.2, Consumer Physics, Tel Aviv, Israel) in the 740-1070 nm range. One spectrum was acquired on each side of the litterbag.
Figure 1.Planting of the litterbags.
Chemical and Biological Analyses of the Soil
In the same days as the litterbag sampling, soil was sampled at a depth of 2-20 cm to measure the nitrate (NO3--N) and ammonium (NH4+-N) concentrations and microbial biomass activity. Nitrate and N-NH4+ were extracted from 10 g of soil using a solution of 100 mL of KCl (2 M); samples were shaken at 100 rpm for 1 h and, after soil sedimentation, a limpid solution was collected and stored at –20°C until analysis, which was performed with an auto analyzer (Auto Analyzer AA3; Bran+Luebbe, Norderstadt, Germany). Microbial respiration was measured using the substrate induced respiration (SIR) method 17 on 50 g of fresh sieved soil (diameter of 2 mm), placed in a 250 ml glass jar and equilibrated at room temperature for at least 24 hours. The samples were then mixed with 200 mg of glucose and incubated at 25°C for 3 hours. The accumulation of CO2 was measured using an IR gas analyzer (Inova 1302, Luma Sense Technologies A/S, Ballerup, Denmark). CO2 concentration was converted into microbial carbon according to17.
Data Handling and Statistical Analysis
The field data replicates were tested for a pairwise comparison by means of the Friedman test for paired samples or by the Kruskal-Wallis test for unpaired samples, using the StatBox V6.5 package (Grimmer Logiciels, Paris, France). Meanwhile, a linear two-way model, with treatment and period, was fitted to the soil and to the chemical variables and foliar composition traits of the litterbags by means of the SAS 9.01 package (SAS Institute, Cary, NC, USA).
Chemometrics of the 331-point NIR spectra was performed using the SCiO Lab proprietary software, by means of a classification procedure based on a random forest algorithm. The reflectance spectra were mathematically transformed as standard normal variates, Log and 1st derivate, and the classification then produced AKA (as known as) confusion matrices according to a six treatment * period or three treatments (final period). The method requires numerical homogeneity between the compared classes, and a probability vs. threshold of 1/6 or 1/3 was tested using the online version of Med-Calc
The chemical composition of the litterbag residues was predicted using a Perkin Elmer IdentiCheck TM instrument (714-3333 nm), and the widest spectra were fed to equations established on twelve species of crops, analyzed at four stages18. The average results of each treatment were used to calibrate the NIR SCiO spectra of each constituent using the partial least square (PLS) procedure of the WinISI II v1.04 (FOSS NIRSystem/Tecator, Infrasoft International, LLC) software on the imported and 1st derived spectrum; cross-validation was applied and elimination of the outliers was permitted with two passages at t =2.
The composition of the fresh tomato leaves was predicted, as indicated in the Sorghumsudanensismycorrhizal paper19.
In order to compare the spectroscopic features with the body of the classificatory information provided by the chemical variables pertaining to the soil and leaves, a modern classifier method, that is, the support vector machine (SVM), provided in the XLStat 2019.4.1 (Addinsoft) package, was used.
A final PLS model, based on the group averages of fifteen independent variables - 10 from the soil and 5 from the leaves – was performed for the yield with the StatBox software, using 2 latent components.
Results
Yield
The supply of organic fertilizer alone (O) or in combination with the microorganism (OM) induced an increase in the tomato yield, in comparison with the mineral fertilization (C) (Table 1), while the supply of the microorganism induced a slightly higher (4.9%, P 0.08) yield than the organic fertilization (Table 1).
Table 1. Effect of the fertilization treatment on yield.| C | O | OM | O\C% | P | OM\C% | P | OM\O% | P | |
| Means t ha-1 | 60.47 | 70.77 | 74.23 | 17.9% | 0.05 | 23% | 0.05 | 4.9% | 0.08 |
Soil and Litterbags
The two forms of mineral N measured in the soil were highly correlated to each other (r=0.94), but were interactively modulated by the organic amendment (Table 2), at a very high level, and the results are therefore reported using a Log scale (Figure 2). The supply of organic fertilizers alone or in combination with Micosat induced an increase in both forms of mineral N in the soil on both sampling dates. However, at day 92, the NH4+-N values were similar between treatments, while NO3--N was higher in the organic amended plots (O) than in the control one (C) (Figure 2).
Table 2. Analyses of the soil and litterbags at the two periods, where the litterbag constituents are ordered by increasing OM\C% values and the r-squares are cross-validated in the NIR SCiO spectra.| Soilanalyses | Period1 | Unit | C | O | OM | O\C% | P | OM\C% | P | OM\O% | P | R2cvin SCiO2 |
| Microbial biomass | 0 | µg Cmic g-1FW | 329.6 | 391.6 | 363.9 | 19% | 0.08 | 10% | 0.56 | -7% | 0.15 | np |
| Microbial biomass | A | µg Cmic g-1FW | 122.4b | 254.6a | 165.9ab | 108% | 0.02 | 36% | 0.25 | -35% | 0.02 | 0.73 |
| Microbial biomass | B | µg Cmic g-1FW | 134.3ab | 108.5b | 184.3a | -19% | 0.43 | 37% | 0.13 | 70% | 0.03 | |
| NO3--N | A | mg kg-1 DM | 2.95c | 112.60b | 215.01a | 3715% | 0.00 | 7185% | 0.00 | 91% | 0.02 | 0.84 |
| NO3--N | B | mg kg-1 DM | 1.42c | 20.92b | 40.95a | 1375% | 0.00 | 2787% | 0.00 | 96% | 0.25 | |
| NH4+-N | A | mg kg-1 DM | 3.51c | 11.30b | 30.47a | 222% | 0.00 | 768% | 0.00 | 170% | 0.02 | 0.66 |
| NH4+-N | B | mg kg-1 DM | 2.71c | 4.23b | 3.61a | 56% | 0.02 | 33% | 0.04 | -15% | 0.56 | |
| Litterbag constituents | ||||||||||||
| Basal respiration | A | µg Cmic g-1FW | 3026 | 3623 | 4288 | 20% | 0.95 | 42% | 0.25 | 18% | 0.95 | np |
| Basal respiration | B | µg Cmic g-1FW | 1966 | 1587 | 1990 | -19% | 0.77 | 1% | 1.00 | 25% | 0.39 | np |
| Protein | A&B | DW% | 12.8 | 11.7 | 10.3 | -8% | 0.22 | -19% | 0.01 | -12% | 0.10 | 0.59 |
| NDF digestibility | A&B | % | 58.2 | 56.0 | 51.8 | -4% | 0.56 | -11% | 0.10 | -8% | 0.25 | 0.63 |
| ADL | A&B | DW% | 8.8 | 8.7 | 7.9 | -1% | 0.90 | -11% | 0.29 | -10% | 0.33 | 0.81 |
| Lipids | A&B | DW% | 3.1 | 2.9 | 2.8 | -6% | 0.37 | -10% | 0.15 | -4% | 0.53 | 0.76 |
| Total digestibility | A&B | % | 80.8 | 77.9 | 75.2 | -4% | 0.14 | -7% | 0.01 | -3% | 0.17 | 0.71 |
| Free sugars | A&B | DW% | 49.8 | 48.0 | 48.4 | -4% | 0.03 | -3% | 0.11 | 1% | 0.62 | 0.78 |
| digestible NDF | A&B | DW% | 31.1 | 30.0 | 30.4 | -3% | 0.26 | -2% | 0.46 | 1% | 0.71 | 0.71 |
| Ash | A&B | DW% | 16.3 | 15.4 | 16.2 | -6% | 0.49 | 0% | 0.97 | 6% | 0.52 | 0.78 |
| Cellulose | A&B | DW% | 23.0 | 22.7 | 23.5 | -2% | 0.84 | 2% | 0.83 | 3% | 0.68 | 0.92 |
| Gross energy | A&B | MJ/kg | 16.0 | 16.1 | 16.4 | 1% | 0.40 | 3% | 0.04 | 2% | 0.17 | 0.77 |
| Fiber Weende | A&B | DW% | 16.0 | 16.6 | 16.6 | 4% | 0.82 | 4% | 0.82 | 0% | 0.99 | 0.76 |
| Hemicellulose | A&B | DW% | 12.3 | 12.7 | 13.2 | 3% | 0.81 | 7% | 0.57 | 4% | 0.73 | 0.71 |
| NDF | A&B | DW% | 42.0 | 46.0 | 45.3 | 10% | 0.06 | 8% | 0.13 | -1% | 0.74 | 0.80 |
| ADF | A&B | DW% | 29.6 | 33.6 | 34.7 | 14% | 0.13 | 17% | 0.07 | 3% | 0.67 | 0.67 |
| non-digestible NDF | A&B | DW% | 19.2 | 22.1 | 24.8 | 15% | 0.14 | 29% | 0.01 | 12% | 0.16 | 0.71 |
| Crop Maturity Index | A&B | Ratio | 0.69 | 1.10 | 1.33 | 60% | 0.03 | 94% | 0.00 | 21% | 0.22 | 0.84 |
Figure 2.Log plot of the NO3--N (continuous line)and NH4+-N (dotted line) in the soil of the three treatments at the two periods (A: 56d; B: 92d).
Soil microbial carbon (Table 2; Figure 3) decreased from point zero (SIR 362) to point A-56 d (181; -50% from zero) and to point B-92 d (142; -21% from B); the decreasing trend was not linear and accelerated in the control and in the OM treatments, showing an interaction vs. O (Figure 2; Table 2).
Figure 3.Plot of the Substrate Induce Respiration (SIR) in the soil of the three Treatments for the three periods (Zero; A: 56d; B: 92d).
Micosat treated plants induced a decrease of protein of 19% vs. C and of 12% vs. O; in addition, the total digestibility was reduced by 7%. The components of the cellular wall were mainly affected by the microbial supply since their concentration raised. In detail the non-digestible NDF increased by 29% and the ADF was enhanced by +17%, which resulted in a rise in the Crop Maturity Index of 94% vs. the C pairing with the O treatment (Figure 4).
Figure 4.Selected features for the variation of the fiber components in the litterbags and their Crop Maturity index.
Figure 5 summarizes the covariation of the 19 variables active on the litterbag template with the factor scores of the three treatments. On the left side, OM was associated with yield, microbial C (SIR), NDF, crop maturity index, NO3--N, undigestible NDF, NH4+-N, gross energy, cellulose and crude fiber. On the right side, C was associated with protein, ash, digestible NDF, total digestibility %, lipids, ADL and free sugars. The O treatment was clearly secluded in an intermediate position and associated with hemicellulose.
Figure 5.Principal Component analysis: plots of 19 active litterbag constituents and factor scores.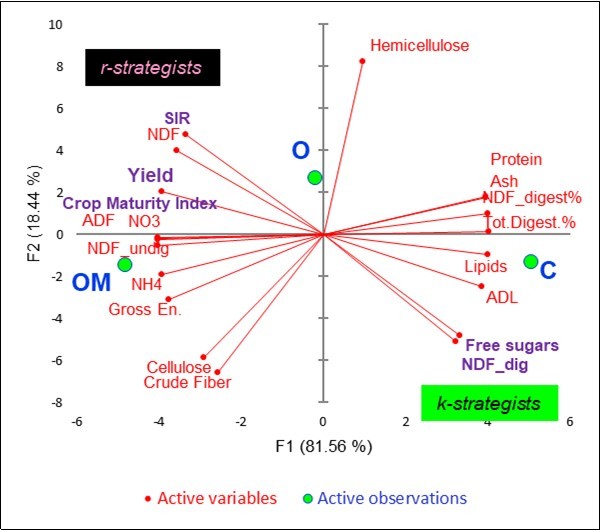
As far as the probable microbial active populations are concerned, the OM soils were associated with a type of rapid r-strategist that was able to oxidize glucose into CO2, as pointed out by the high SIR values and the concentration of the less available cellular wall components. Conversely, the C soils benefitted from the slow k-strategist populations that had preserved the most labile substances of the hay in the litterbags.
Correlation of the Soil Substrate Induced Respiration (SIR), NO3--N and NH4+-N with the Litterbag-NIRS
The average reflectance of the C litterbags (Figure 7) was 0.293, a value that was exceeded by O (0.329, +12%) and by OM (0.359, +23%).
Figure 7.Average reflectance spectra of the litterbags.
The calibrations were all positive (Table 2). Microbial C was predicted with R2=0.73 (Figure 8): moreover, NO3--Nwas also well predicted by means of NIRS (0.84) and more than the NH4+-N (0.66).
Figure 8.Scatterplot of the (Y) predicted \ (X) measured soil SIR (µg Cmic g-1 FW), values from the Litterbag-NIRS.
Comparison of the Litterbag-NIRS Method with the Laboratory Analyses
The fingerprinting of the treatments (C, O, OM)in the two periods (A, B) from the Litterbag-NIRS method was highly significant with 63% on average (Table 3); a minimum value of 40% (vs. threshold 17%) was observed in C-A and OM-B, while C was recovered more constantly, with a maximum of 87% at period A, and this was confirmed with 71% at period B. When the four biochemical variables (litterbag basal respiration, soil respiration, nitrate, ammonium) were run into the support vector machine, the results of the classification were similar at around 71%. Based on the 18 NIRS chemical predictions (Table 3, point 3), the classification reached a similar average value of 63%.
Table 3. Fingerprinting of the Treatments * Periods by using Litterbag-NIRS or the bio-chemical analyses.| Threshold 17% | C-A | C-B | O-A | O-B | OM-A | OM-B |
| Litterbag-NIRS | 87% | 40% | 62% | 71% | 40% | 75% |
| P (No. 20) | 0.0001 | 0.0062 | 0.0001 | 0.0001 | 0.0001 | 0.0062 |
| Support vector machine-V41 | 50% | 50% | 100% | 75% | 100% | 50% |
| P (No. 4) | 0.0789 | 0.0789 | 0.0001 | 0.0002 | 0.0001 | 0.0789 |
| P (1 vs. 2) | 0.0929 | 0.7170 | 0.1443 | 0.8739 | 0.0320 | 0.3256 |
| Support vector machine-V18 (Litterbag composition) | 25% | 75% | 100% | 50% | 75% | 50% |
| P (No. 4) | 0.6701 | 0.0020 | 0.0001 | 0.0789 | 0.0020 | 0.0789 |
1The variables were: litterbag basal respiration, SIR of the soil, nitrate and ammonium, repeated at periods A and B. Period A refers to 56 d from sowing and 20 d from placing of the litter bags; period B refers to 92 d from sowing and 56 d from placing of the litterbags.
Foliar-NIRS
The reflectance of the leaves (Figure 6) was higher than in the spectra of the degraded hay from the litterbags, and the 950 nm region showed the typical saddle-shape due to water absorbance. It should be noted that the lowest values were observed for the O group (0.721) and this was followed by the C group and then by the OM. This shape was confirmed when the three treatments were distinguished into the four S2-like NIRS bands, as shown in Figure 7. These variables appear at the bottom of Table 4 as the most important variables paired with the hemicellulose, ADF and NDF digestibility, and they increased in the O and OM groups. The O treatment excelled in four components (ash, lipids, non-digestible NDF, ADF). The increase in the fiber components in the OM treatment was limited to +1.8% (ADF) and +3.4% (ADL), but the Crop Maturity Index contextually appeared reduced by 2.1%.
Figure 6.Average reflectance spectra of the leaves, upper face.
| Leaf Constituents | Unit | C | O | OM | O\C% | P | OM\C% | P | OM\O% | P |
| Free sugars | DW% | 44.51a | 42.95b | 43.01b | -3% | 0.00 | -3.4% | 0.00 | 0% | 0.88 |
| Ash | DW% | 6.95b | 7.37a | 6.74b | 6% | 0.22 | -3.0% | 0.22 | -9% | 0.00 |
| Crop maturity index | Ratio | 2.29a | 2.20b | 2.24b | -4% | 0.02 | -2.1% | 0.02 | 2% | 0.07 |
| non-digestible NDF | DW% | 29.83b | 30.22a | 29.66b | 1% | 0.15 | -0.6% | 0.15 | -2% | 0.00 |
| Protein | DW% | 8.16 | 8.04 | 8.12 | -2% | 0.66 | -0.5% | 0.66 | 1% | 0.43 |
| Lipids | DW% | 1.28b | 1.30a | 1.28b | 2% | 0.71 | -0.3% | 0.71 | -2% | 0.01 |
| Total digestibility | % | 70.10 | 69.93 | 70.07 | 0% | 0.86 | 0.0% | 0.86 | 0% | 0.22 |
| Cellulose | DW% | 24.93a | 23.88b | 24.93a | -4% | 0.99 | 0.0% | 0.99 | 4% | 0.00 |
| Gross energy | MJ kg -1 | 17.36b | 17.38a | 17.38a | 0% | 0.02 | 0.1% | 0.02 | 0% | 0.87 |
| NDF | DM% | 47.27a | 46.20b | 47.34a | -2% | 0.78 | 0.2% | 0.78 | 2% | 0.00 |
| predicted pH | pH | 5.08b | 5.07b | 5.11a | 0% | 0.06 | 0.4% | 0.06 | 1% | 0.01 |
| Dry Matter | DW% | 29.45ab | 29.09b | 29.60a | -1% | 0.51 | 0.5% | 0.51 | 2% | 0.02 |
| digestible NDF | DW% | 24.58 | 24.57 | 24.73 | 0% | 0.40 | 0.6% | 0.40 | 1% | 0.37 |
| Fiber Weende | DW% | 27.24 | 27.33 | 27.44 | 0% | 0.14 | 0.7% | 0.14 | 0% | 0.43 |
| pH measured | pH | 6.25b | 6.15c | 6.34a | -2% | 0.00 | 1.4% | 0.00 | 3% | 0.00 |
| ADF | DW% | 45.65c | 47.85a | 46.46b | 5% | 0.01 | 1.8% | 0.01 | -3% | 0.00 |
| NDF digestibility | % | 43.31b | 44.26a | 44.13a | 2% | 0.03 | 1.9% | 0.03 | 0% | 0.74 |
| ADL | DW% | 8.13b | 8.28b | 8.41a | 2% | 0.02 | 3.4% | 0.00 | 2% | 0.29 |
| S21 band -d9 | Ref. | 0.74b | 0.72c | 0.77a | -3.1% | 0.00 | 4.8% | 0.00 | 8% | 0.00 |
| S21 band -c8a | Ref. | 0.77b | 0.74c | 0.81a | -3.2% | 0.00 | 5.1% | 0.00 | 9% | 0.00 |
| S21 band -c7 | Ref. | 0.75b | 0.73c | 0.79a | -3.4% | 0.00 | 5.8% | 0.00 | 10% | 0.00 |
| S21 band -b6 | Ref. | 0.67b | 0.66b | 0.72a | -1.0% | 0.00 | 7.0% | 0.00 | 8% | 0.00 |
| Hemicellulose | DW% | 5.25b | 3.94c | 5.88a | -25% | 0.00 | 12.0% | 0.00 | 49% | 0.00 |
Comparison of the Foliar-NIRS Method with the Laboratory Analyses
A valid fingerprinting of the treatments was obtained from the NIRS of the leaves, that is, 78% on average, compared to similar values of 94% for the SVM classification, which involved a pool of 23 leaf variables (Table 5).
Table 5. Fingerprinting of the three Treatments (C, O, OM) from the foliar-NIRS and from a multivariate support vector machine classification of 19 predicted chemical variables and 4 spectroscopic ones.| 33% threshold | C | O | OM |
| Foliar-NIRS | 72% | 85% | 78% |
| P (No.20) | 0.0002 | 0.0001 | 0.0001 |
| Multivariate support vector machine | 93% | 100% | 88% |
| P (No.20) | 0.0001 | 0.0001 | 0.0001 |
| P (1 vs. 2) | 0.0844 | 0.0754 | 0.4058 |
Bottom-up Approach: Predictability of the Yield from this Experiment
The most important below-ground variable for yield (Table 6) resulted to be the NO3- -N variable measured in the soil, more so in the first period (index 100%) than in the second one (38%), although the N-NH4+ variable showed a similar importance, althought limited to the first period (80%). Microbial C showed a limited incidence (50% and 42%). The fingerprinting of the litterbags only appeared important in the first period (-65%) and showed an inverse relationship: low fingerprint vs. high yield, and vice versa. As far as the foliar-NIRS is concerned, a closer relationship can be observed, and the R2rose to 0.95.
Table 6. Partial least squares regression of the variables from the soil, litterbags and leaves on the yield.| Period | Soil, Litterbag | STDCoeff. | Index | STDCoeff. | Index |
| Soil | |||||
| A | NO3--N | 0.34 | 100% | ||
| A | NH4+-N | 0.27 | 80% | ||
| A | SIR | 0.17 | 50% | ||
| Litterbags | |||||
| A | Respiration | 0.03 | 9% | ||
| A | % Litterbag | -0.22 | -65% | ||
| B | NO3--N | 0.13 | 38% | ||
| B | NH4+-N | 0.03 | 9% | ||
| B | SIR | 0.14 | 42% | ||
| B | Respiration | -0.06 | -17% | ||
| B | % Litterbag | 0.02 | 5% | ||
| Leaves | |||||
| B | % Foliar NIRS | 0.88 | 100% | ||
| B | b61 | 0.39 | 45% | ||
| B | c71 | 0.13 | 15% | ||
| B | c8a1 | 0.12 | 13% | ||
| B | d91 | 0.11 | 12% | ||
| R2 | 0.88 | 0.95 | |||
1 Like the Sentinel-2 EOS Satellite band: b6 (740-750 nm); c7 (773-793 nm); c8a (855-875 nm); d9 (935-955 nm).
When only the Litterbag-NIRS and Foliar-NIRS methods were combined in a multiple regression model, similar results could were obtained, in terms of r-square (0.95), with partial r2values 0.45 from the Litterbag-NIRS and 0.50 from the foliar-NIRS (Table 7; Figure 9).
Table 7. Multiple regression model of the yield from the Litterbag-NIRS and Foliar-NIRS.| Coefficients | STD | Partial r2 | Total R2 | |
| Constant | -116.06 | |||
| % Litterbag-NIRS Fingerprinting (C, M, OM) | 49.23 | 1.28 | 0.45 | 0.45 |
| % Foliar-NIRS Fingerprinting (C, M, OM) | 196.63 | 1.74 | 0.50 | 0.95 |
Figure 9.Bilinear regression of the Yield on the %Fingerprinting of the litterbags and leaves.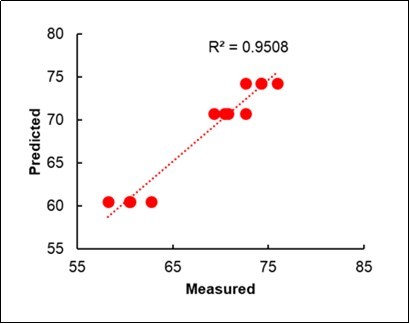
Top-down Approach: Predictability of the Biofertilized (M) or Control (C) Status From Previous Models
The top-down application of 14 previous Litterbag-NIRS models for the assignment of the status of biofertilized (M ) or untreated Control (C ) (Table 8) showed that the C status was significantly predicted (68%), while the M status was significantly misclassified, with only 34% of fingerprinting. Thus, on the basis of the previous knowledge of the litterbags, 2/3 of the OM were not recognized as being M. This suggests the presence of an original type of microbial litterbag type, while the control was compliant with the previous known types.
Table 8. Prediction of the Control (C) or biofertilized (M) status of the litterbags from 14 previous models| C (C&O) | M (OM) | C /M | |
| Fingerprinting% | 68% | 34% | +97% |
| P | 0.0024 | 0.043 | 0.004 |
Discussion
From the present experiment we were able to observe an increase of tomato yield by 18% thanks to the use of organics amendments able to partially restore soil sickness due to several successions of tomato cultivation. Moreover, the activity of the organic amendment was little (+5%) enhanced by the supply of the biofertilizer complex. It should be also noted that the control yield (60.5 t ha-1)was very low for the area that is usually characterized by production ranging around 65 to 95 t ha-1.
As summarized in the model reported in Table 7, a greater availability of both N species in the first period and of NO3--N in the second period was the lever that led to a higher yield; it should be noticed that these two parameters had a high CV of around 130%; microbial C was the least variable parameter (CV= 48%), but it did not show covariation with the treatments, even though it registered the highest value in the first month. Microbes stimulated by organic amendments are only aerobic, thus an increase in microbial biomass could be expected. However, the response could be the result of a complex polydromic function, resulting from the multitude of autochthonous microorganisms and as a response to the glucose added to the soil in the test. Soil microorganisms have a great potential to adaptively vary their growth traits, according to the energy source and its availability20. Although, according Fontaine et al.21, a wide range of microbial types are present in soil, only a few of them can adapt to the dominant soil organic resource, while the others remain dormant i.e. in a viable but non-culturable state. After fresh organic matter (FOM) is supplied to soils, or vital newborn roots start to develop into the soil, many dormant microorganisms are triggered into activity, and this leads to dramatic changes in the structure of the microbial community. It is important to recall that at first time FOM specialized microorganisms, which are commonly classified as r-strategists, adapt to rapid growth intervals, become dominant. After substrate exhaustion, r-strategists die or become dormant because they are unable to use soil organic matter (SOM). At that point other microorganisms labelled as k-strategists occurred to attack SOM. They grow slowly and only dominate in the last stages of FOM decomposition. In the present experiment we have observed a general reduction of the microbe r-strategist from point zero (SIR 362) to point A-56 d (181; -50% from 0) and to point B-92 d (142; -21% from B), this mainly because these microbes easily attack the glucose added to soil microbial biomass determination. However, a polydromic function must describe level and evolution of SOM and microbes at different times. What did the O and OM treatments do that was different from the Control? The C and OM treatments lost more rapidly the r-strategist population vs. O, which only collapsed in the final period. The SIR technique is not enough to distinguish between the C and OM treatment; consequently, it is necessary to take into consideration the evolution of the litterbag composition which more closely reflects the population of the slow k-strategists that were able to attack the cellular walls of the hay in litterbags. Hence, it is possible to observe, in Figure 4, that the crop maturity index of the degrading hay increased to a great extent as the digestible fraction of the NDF reduced. As far as the hypothesis of a polydromic function is concerned, the organic amendment delayed the functionality of the r-strategists, but at the same time activated the k-strategists to feed the walls. Something similar occurred for the biofertilized OM treatment which, however, antagonized the rapid microbes at the control (C) level early on, as clearly shown by the presence of the saddle in Figure 2.
A new finding of hay litterbags has emerged concerned their intrinsic basal respiration. In fact, the values were nearly tenfold higher than the SIR of the soil at period zero. Sapronov and Kuzyakov22, in a laboratory, separated the soil CO2 flux into the root respiration of maize plants and the respiration of the rhizosphere and nonrhizosphere microorganisms, and concluded that the contribution of the roots alone was 8–19%, while that of the non-rhizosphere microorganisms was 51–82%.
The results of the present experiment agree with previous results obtained from Litterbags-NIRS and from Foliar-NIRS in biofertilizer experiments. The anomaly of the pH - which increased by 3% and 14% - instead of reducing by about 1-3%, as usually observed in other experiments involving AM23,24,25 - may be due to an excessive delay between the sampling and pH measurement, but this cannot have affected the general structure of the leaves in the optical path traversed by the NIR beam. Notice that the reflectance of the leaves measured by the researchers’ version of the SCiO device (linked to a repository of collections and spectra providing a downloading management) is more useful than a Leaf Chlorophyll Meter, which has a similar price, when the influence of the factors exceeded from the chlorophyll - protein domain, for example, when an experiment is aimed at modifying ontogenic traits, in particular the development of the cell walls and to vary the Crop Maturity Index or similar complex traits18,26. The relationship with the Sentinel-2 b6 band, which on average explained 39% of the yield variations, is interesting. Therefore, this tool could be proposed for remote agriculture purposes.
The most meaningful result of the current experiment was that obtained from proximal spectroscopy, which established significant and useful correlations of several components of the litterbags with the short region of the NIR rays. The development of spectroscopy led to concrete interest in portable NIR devices27,28, but especially in SCiO systems, for the prediction of the horticultural products quality29, to maize single kernel quality33 and the application of NIR tomoscopy to animals30and the application of NIR tomoscopy to animals30. This Foliar-NIRS method therefore remains an underestimated tool for the rapid phenotyping of plants, especially when the relationships between plants and AM are studied, contextually with a lowering of the foliar pH14,19,24,25.
Conclusion and Perspectives
According to van Veen et al31, the greatest problem of inoculating soil for beneficial purposes is the general obstinacy of the soil ecosystem, which normally acts as a buffer against any incoming microorganisms. From the perspective of the attackers, provided by strong ecological selectivity, this recalcitrance of the system can be overcome, and the selected organism can become established and active. The greatest chance for the success of microbial introductions for unselected or poorly selected inoculants might be when the normal homeostasis of the system is (temporarily) disturbed, as this can result in an alleviation of anti-invader pressure. In our opinion, when considering the minimal dose\effect results that have sometimes been obtained in real fields, that is, far from artificial (and often aseptic) sterile laboratory conditions, and with very high (non-economic) doses, we can hypothesize a collateral multi-purposes player that restores some strategic functionality that is blocked in the soil. We must draw inspiration from the Van Nood et al.32 fecal transplant model first to solve the deadly recurrent Clostridium difficile diarrhea in humans. In the current experiment, the complex nature of the crude inoculum inherent to the commercial microbial consortium Micosat F may have catalyzed a symbiotic profile, as testified by the yield results and by the phenotype effects on the tomato plants, and foreseen for the selective degradation of the litterbags. The debate on multitude (quantity) vs. handful (quality and variability) remains open. But the right answers to a good question are in the normal soils. As far as rapid methods are concerned, there is only one answer: when the aim of an experiment is to obtain knowledge on the effect of an organic amendment or a biofertilizer complex, considering a multitude of unknown soil microorganisms, it is easier and quicker to scan litterbags and leaves than to perform laborious analyses of the roots, soil and leaves. The close correlation between the short NIR SCiO spectra of the cell wall compounds and of other components of the litterbags is further confirmation of the results of the first paper of the litterbag series8. However, this paper can open new scenarios pertaining to the planning of biofertilizer \ bioinoculants experiments and the interpretation of the results, whether in bottom-up or top-down mode, as Litterbag-NIRS models will grow from experiments and symbiotic field-testing operations. In short, SIR alone cannot fully explain the soil fertility orchestrated by a complex and very assorted Biofertilizer: traces of the microbial work and footsteps can be found - almost archaeologically- in the NIR spectra of the litterbags and from the inherent substances, in primis in the fibers declared to be digestible, such as in rumen, as well as in the free sugar variations of degrading hay. Rumen obviously can host only anaerobic microbes, but the soil has equivalent aerobic priming and factors for SOM attack, where AM are the corner stones for long-life microbial fertility. Rapid spectroscopic analyses, and Litterbag-NIRS in particular, are therefore recommended for a rational assessment of microbial soil fertility before and during the use of biofertilizers or bioinoculants.
Acknowledgments
Thanks to Roberto Dalpozzo (Demetra Italia S.r.l., Castel Guelfo, Italy), Fabio Pelliconi (Consorzio Agrario di Ravenna, Cotignola, Italy) and Giusto Giovannetti (CCS-Aosta S.r.l., Quart, Italy) for the valuable support to ideation and execution of the experiment.
References
- 1.Swift M J, Palm C A. (2002) Soil fertility as an ecosystem concept: A paradigm lost or regained? In: Accomplishments and changing paradigm towards the 21st Century.Proceedings of the 17thworld congress of soil science. , Bangkok, Thailand 14-21.
- 2.Genot V, Colinet G, Bock L.Vanvyve ,et al.(2011) Near infrared reflectance spectroscopy for estimating soil characteristics valuable in the diagnosis of soil fertility.Journal of Near Infrared. Spectroscopy19 117-138.
- 3.Cécillon L, Barthès B G, Gomez C, Ertlen D, Génot V et al. (2009) Assessment and monitoring of soil quality using near‐infrared reflectance spectroscopy (NIRS).European. , Journal of Soil Science60 770-84.
- 4.Jiang Q, Chen Y, Guo L, Fei T, Qi K. (2016) Estimating soil organic carbon of cropland soil at different levels of soil moisture using VIS-NIR spectroscopy.Remote. Sensing8 755.
- 5.Munnaf A M, Nawar S, Mouazen A M. (2019) . Estimation of Secondary Soil Properties by Fusion of Laboratory and On-Line Measured Vis–NIR Spectra.Remote Sensing11 2819.
- 6.Chaparro J M, Sheflin A M, Manter D K, Vivanco J M.Manipulating the soil microbiome to increase soil health and plant fertility. (2012)Biology and Fertility of Soils48 489-99.
- 7.Dalias P, Mprezetou I, Troumbis A Y. (2003) Use of a modified litterbag technique for the study of litter mixtures.European journal of soil biology39. 57-64.
- 8.Masoero G, G Delmastro M Cugnetto A, Nuti M. (2018) NIRS footprint of bio-fertilizers from hay litterbags.Journal of Agronomy Research1. 22-33.
- 9.Piazza G, Ercoli L, Nuti M, Pellegrino E. (2019) Interaction Between Conservation Tillage and Nitrogen Fertilization Shapes Prokaryotic and Fungal Diversity at Different Soil Depths: Evidence From a 23-Year Field Experiment in the MediterraneanArea.Front. Microbiol.10 1-20.
- 10.Giovannetti M, Mosse B. (1980) An evaluation of techniques for measuring vesicular arbuscular mycorrhizal infection in roots.Newphytologist1. 489-500.
- 11.Cardini A, Pellegrino E, Del Dottore E, Gamper H A, Mazzolai B et al. (2020) HyLength: a semi-automated digital image analysis tool for measuring the length of roots and fungal hyphae of dense mycelia.Mycorrhiza16. 1-4.
- 12.Tran B T, Watts-Williams S J, Cavagnaro T R. (2019) Impact of an arbuscular mycorrhizal fungus on the growth and nutrition of fifteen crop and pasture plant species.Functional Plant Biology.46(8):. 732-42.
- 13.Loján P, Senés-Guerrero C, Suárez J P, Kromann P, Schüßler A et al. (2017) Potato field-inoculation in Ecuador withRhizophagusirregularis: no impact on growth performance and associated arbuscular mycorrhizal fungal communities.Symbiosis73. 45-56.
- 14.Volpato S, Masoero G, Mazzinelli G.Balconi C,et al.(2019) Spectroscopic and foliar pH Model for Yield prediction in a Symbiotic Corn Production.Journal of Agronomy Research2. 3, 1-18.
- 15.Masoero G, Mazzinelli G, Balconi C, Locatelli S. (2020) . Spectroscopic Kernel Quality from a Symbiotic Corn Production.Journal of AgronomyResearch2 4, 18-33.
- 16.Volpato S, Masoero G, Giovannetti G, Nuti M. (2020) Arbuscular Mycorrhizal Biofertilizers sources in the potato (Solanum tuberosum) plant show interactions with cultivars on yield and litterbags spectral features.Journal of Agronomy Research. 2(4), 10-17.
- 17.Anderson J, Domsch K. (1978) A physiological method for the quantitative measurement of microbial biomass in soils.Soil Biol.Biochem.10,215–221.
- 18.Tassone S, Masoero G, Peiretti P G. (2014) Vibrational spectroscopy to predict in vitro digestibility and the maturity index of different forage crops during the growing cycle and after freeze- or oven-drying treatment.Animal Feed SciTechn. 194, 12-25.
- 19.Masoero G, Peiretti P G, Cugnetto A, Giovannetti G. (2018) Raw pH fall-out as a sign of a mycorrhizal modifier ofSorghumsudanensis.Journal of Agronomy Research1:. 2, 1-11.
- 20.Blagodatskaya E V, Blagodatsky S A, Anderson T H, Kuzyakov Y. (2009) Contrasting effects of glucose, living roots and maize straw on microbial growth kinetics and substrate availability in soil.European. , Journal of Soil Science60 186-97.
- 21.Fontaine S, Mariotti A, Abbadie L. (2003) The priming effect of organic matter: a question of microbial competition?Soil Biology and. Biochemistry35 837-43.
- 22.Sapronov D V, Kuzyakov Y V. (2007) Separation of root and microbial respiration: comparison of three methods. Eurasian Soil Science. 40(7), 775-84.
- 23.Masoero G, Giovannetti G. (2015) In vivo Stem pH can testify the acidification of the maize treated by mycorrhizal and microbial consortium.Journal of Environmental. Agricultural Sciences3 23-30.
- 24.Masoero G, Cugnetto A. (2018) The raw pH in plants: a multifaceted parameter.Journal of Agronomy Research. 1(2), 1-11.
- 25.Giovannetti G, Polo F, Nutricato S, Masoero G, Nuti M. (2019) Efficacy of commercial symbiotic bio-fertilizer consortium for mitigating the Olive Quick Decline Syndrome (OQDS). , Journal of Agricultural Research 2(1), 1-21.
- 26.Peiretti P G, Tassone S, Masoero G. (2015) Lipid maturity trend in crops as characterized by α-linolenic acid decay and by. NIRS study.Journal of Environmental & Agricultural Sciences5 4-16.
- 28.Wiedemair V, Huck C W. (2018) Evaluation of the performance of three hand-held near-infrared spectrometer through investigation of total antioxidant capacity in gluten-free grains.Talanta189. 233-40.
- 29.Li M, Qian Z, Shi B, Medlicott J, East A. (2018) Evaluating the performance of a consumer scale SCiO™ molecular sensor to predict quality of horticultural products.Postharvest Biology and. Technology145 183-92.
- 30.Meineri G, Candellone A, Masoero G, Peiretti P G. (2020) Smart NIR tomoscopy to predict oxidative stress in rabbits.Progress in. , Nutrition 22(4).
- 31.Van Veen JA, van Overbeek LS, van Elsas JD. (1997) Fate and activity of microorganisms introduced into soil. , Microbiol.Mol. Biol. Rev 61, 121-35.
Cited by (10)
- 1.Nuti Marco, Giovannetti Giusto, Scortichini Marco, Pergolese Giovanni, Saracino Michele, et al, 2021, The Olive Quick Decline Syndrome: A Syndemic Outbreak in the Apulia Region, Southern Italy, Journal of Agronomy Research, 3(3), 13, 10.14302/issn.2639-3166.jar-21-3703
- 2.Masoero Giorgio, Cugnetto Alberto, Sarasso Giuseppe, D’Amore Giovanni, Giovannetti Giusto, et al, 2020, UV rays Decrease Foliar pH in Cress (Lepidium Sativum) and Modify NIR Spectrum, Journal of Agronomy Research, 3(2), 17, 10.14302/issn.2639-3166.jar-20-3639
- 3.Masoero Giorgio, Ariotti Riccardo, Giovannetti Giusto, Ercole Enrico, Cugnetto Alberto, et al, 2021, Connecting the use of Biofertilizers on Maize silage or Meadows with Progress in Milk Quality and Economy, Journal of Agronomy Research, 3(3), 26, 10.14302/issn.2639-3166.jar-21-3782
- 4.Masoero Giorgio, Oggiano Philipp, Migliorini Paola, Taran Aliaksei, Nuti Marco, et al, 2022, Litterbag-NIRS to Forecast Yield: a Horticultural Case with Biofertilizer Effectors, Journal of Soil Science and Plant Nutrition, 22(1), 186, 10.1007/s42729-021-00643-5
- 5.Baldi Elena, Gioacchini Paola, Montecchio Daniela, Mocali Stefano, Antonielli Livio, et al, 2021, Effect of Biofertilizers Application on Soil Biodiversity and Litter Degradation in a Commercial Apricot Orchard, Agronomy, 11(6), 1116, 10.3390/agronomy11061116
- 6.Hett Jonas, Neuhoff Daniel, Döring Thomas F., Masoero Giorgio, Ercole Enrico, et al, 2022, Effects of Multi-Species Microbial Inoculants on Early Wheat Growth and Litterbag Microbial Activity, Agronomy, 12(4), 899, 10.3390/agronomy12040899
- 7.Farooqi Zia Ur Rahman, Qadir Ayesha Abdul, Alserae Hussein, Raza Ali, Mohy-Ud-Din Waqas, 2023, Organic amendment–mediated reclamation and build-up of soil microbial diversity in salt-affected soils: fostering soil biota for shaping rhizosphere to enhance soil health and crop productivity, Environmental Science and Pollution Research, 30(51), 109889, 10.1007/s11356-023-30143-1
- 8.Cugnetto Alberto, Lajolo Luciano, Vitaloni Giovanni, Sarasso Giuseppe, Borgogno Mondino Enrico Corrado, et al, 2021, Vineyard Clusters Monitored by Means of Litterbag-NIRS and Foliar-NIRS Spectroscopic Methods, Journal of Agronomy Research, 3(2), 39, 10.14302/issn.2639-3166.jar-20-3676
- 9.Aguilar-Paredes Ana, Valdés Gabriela, Nuti Marco, 2020, Ecosystem Functions of Microbial Consortia in Sustainable Agriculture, Agronomy, 10(12), 1902, 10.3390/agronomy10121902
- 10.Masoero Giorgio, Sarasso Giuseppe, Delmastro Marco, Delmastro Renato, Antonini Massimiliano, et al, 2023, Soluble Biobased Substances in soil or Salicylic Acid on leaves affect the foliar pH and soil biovariability of Grapes-as explained by the NIR Spectroscopy of Litterbags and Teabags, Journal of Agronomy Research, 5(2), 10, 10.14302/issn.2639-3166.jar-23-4648